Testimony
Remarks before Congress by Dr. Bill Beach on "Reducing America’s National Debt: Rooting Out Federal Waste, Fraud, and Overregulation"
May 14, 2026 · William W. Beach, D. Phil.


 All this unhappiness begs for a culprit. Who is to blame for the dark mood of the American public? There is a long list of candidates, and everyone likely has his favorite; but prices rising faster than incomes for more than two years must be nearly everyone’s top choice. So, who is to blame for that? The answer points to federal spending.
Federal spending is such a likely culprit because of the outsized impact that the government’s spending and borrowing has on household and business expenditures. The federal government’s spending is almost always targeted at specific groups and organizations. That is easiest to see with entitlement spending, where a person’s age, disability status, income level, and so forth are used to qualify for a payment. When the federal government buys products or subsidizes research, the funds go to specific organizations and people. If policymakers determine that vastly more citizens should receive support payments and that vastly more money should be spent on, say, health care and defense contractors, then households and businesses with subsequently higher incomes may begin to spend more themselves on goods and services. Household and business spending can cause prices to rise until the supply of goods and services increases to meet the increased demand. Economists argue that this demand effect produces short-term price growth.
However, that is just the outlay side of the story. Federal spending in times of emergency often outstrips the government’s income, causing the government to borrow from private and public lenders to make up the difference. The Federal Reserve frequently helps to fund government deficits by buying this new government debt. That debt is then held by banks of the Federal Reserve System as assets, which these banks in turn lend out to households and businesses as private loans. Due to a completely legal banking practice called fractional reserve lending, a bank holding federal debt as an asset can create loans for households and businesses that, added together, are several times more than the amount of that asset.
It is this channel of federal spending to households and businesses that is more responsible for fueling inflation than the direct spending discussed above, though that, too, plays a role. For example, a $100 billion federal deficit that is funded by banks buying $100 billion in Treasury bonds can result in as much as $700 billion in private loans, once fractional reserve lending kicks in. Households use their loans for mortgages and credit card purchases, and businesses use their loans to expand their factories, buy new equipment, and hire more workers. If the funded deficits are small, little harm is done to the price system. However, significant and sustained, above- normal deficit spending can cause prices to rise far faster than that implied by the growth in private incomes, thus engendering more private borrowing to keep up with the increasing gap between private spending and private income.[2]
Economic theory predicts rapid increases in prices when demand increases suddenly due to above-normal increases in credit. That is, households expand their spending because credit is more affordable and more abundant. Of course, household demand can rise because household earned income increases, but that rarely results in dramatic growth in inflation. If a worker’s income rises because he or she is more productive, then that productivity could mean that goods are produced more efficiently, which could even lead to price decreases. Demand could grow because prices are lower. However, if productivity is unchanged and credit is more available and affordable, households will spend without the offset of productivity gains, and inflation can result.
Did this happen, and is there a case that deficits funded by the Federal Reserve caused credit to rise and inflation to result? Let’s walk through the required chain of events step by step.
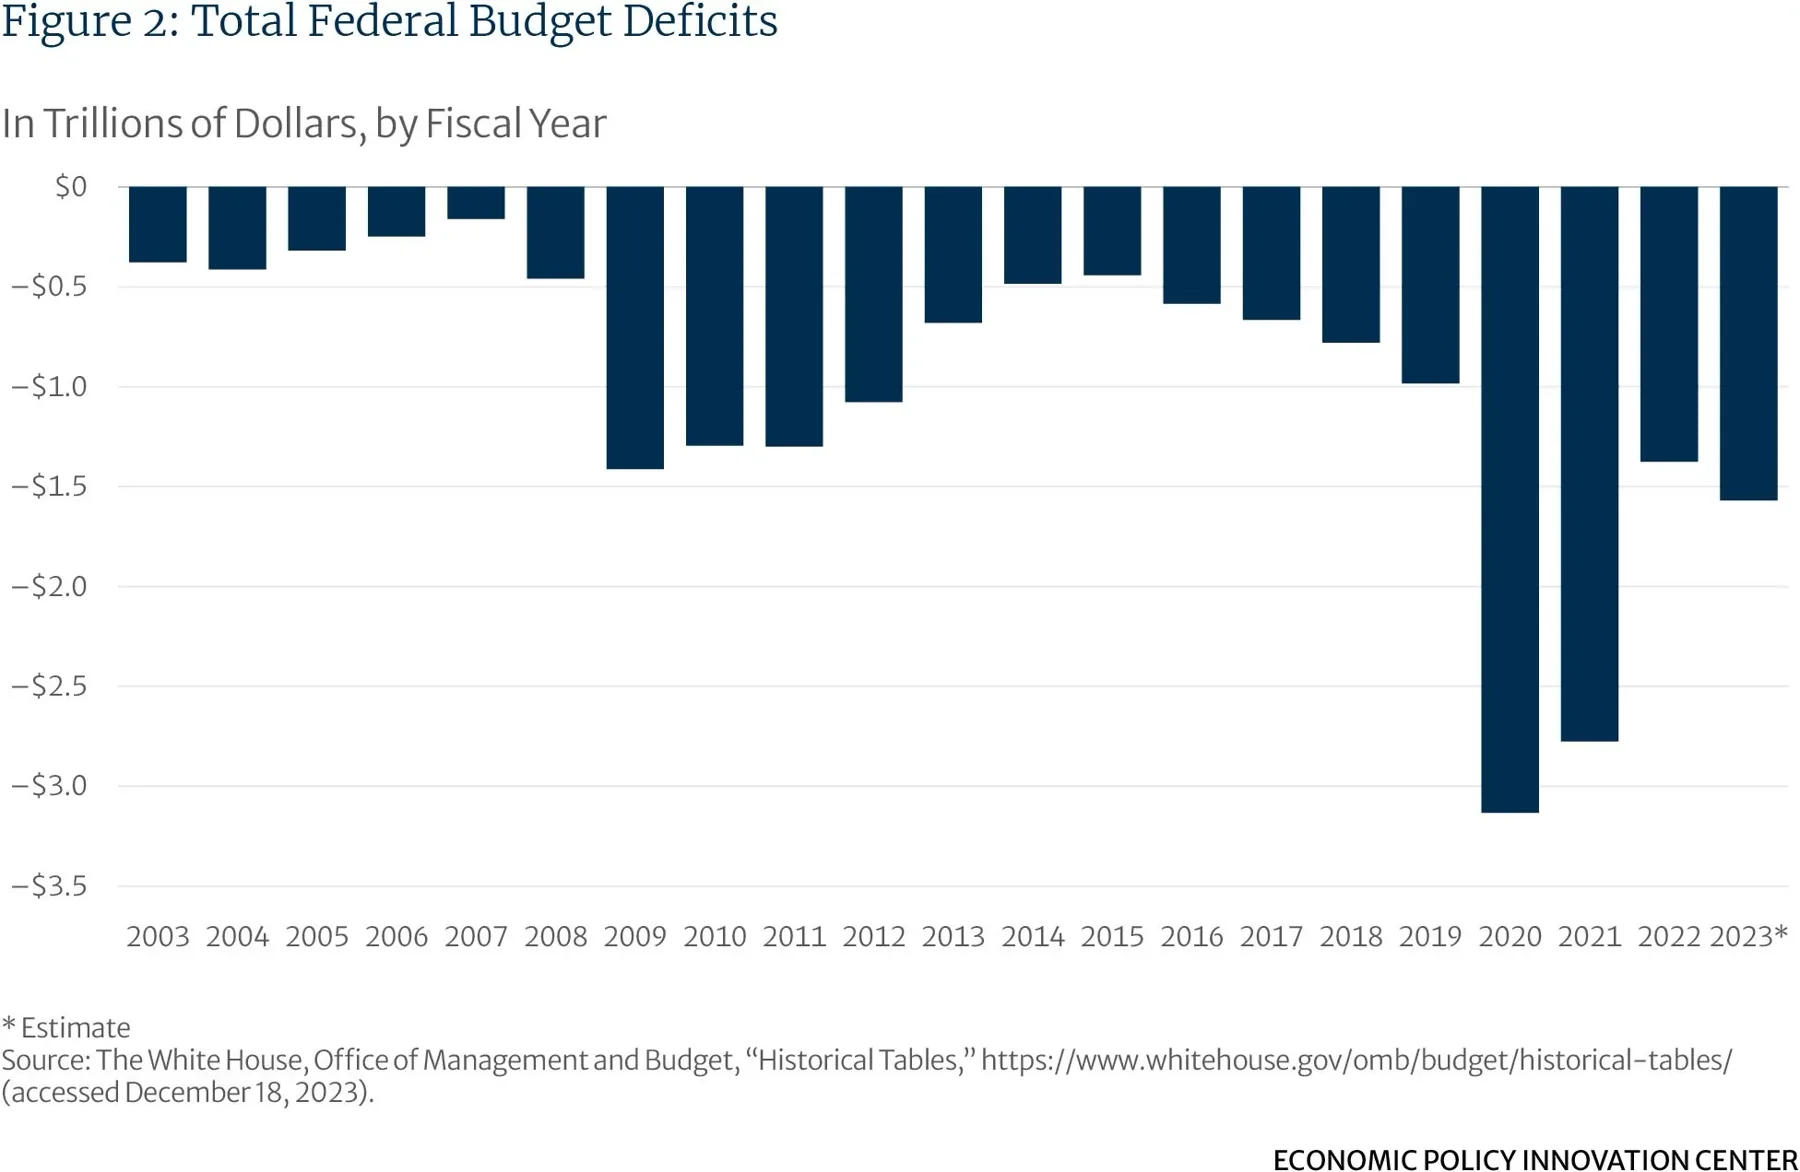
Let’s first look at spending. Between 2019 and 2023, federal outlays outstripped revenues by an average of $2.2 trillion per fiscal year (FY). Adding up the deficits for FY 2020 through FY 2023 totals $8.8 trillion. Outside of wartime, no four-year period in U.S. history has seen deficits this large, either in nominal terms or as a percent of GDP. (See Figure 2.)[3]
Debt held by the public rose by almost the same amount over that period, $8.9 trillion.[4] These deficits then were funded by the public (banks, individuals, companies, and governments, principally foreign) through purchases of government bonds.
How did the banking system react to all these new Treasury securities? The total bank assets of all U.S. commercial banks grew by 25.4 percent in just two years, 2020 and 2021, of which securities held as assets increased by 42.8 percent. Over the period 2021 to 2022, consumer loans grew by 19.2 percent, real estate loans grew by 12.1 percent, and the total loans of the banking system grew by 13.7 percent. The last time there was such a jump in lending was in 2005 and 2006, just prior to the Great Recession.[5]
All this unhappiness begs for a culprit. Who is to blame for the dark mood of the American public? There is a long list of candidates, and everyone likely has his favorite; but prices rising faster than incomes for more than two years must be nearly everyone’s top choice. So, who is to blame for that? The answer points to federal spending.
Federal spending is such a likely culprit because of the outsized impact that the government’s spending and borrowing has on household and business expenditures. The federal government’s spending is almost always targeted at specific groups and organizations. That is easiest to see with entitlement spending, where a person’s age, disability status, income level, and so forth are used to qualify for a payment. When the federal government buys products or subsidizes research, the funds go to specific organizations and people. If policymakers determine that vastly more citizens should receive support payments and that vastly more money should be spent on, say, health care and defense contractors, then households and businesses with subsequently higher incomes may begin to spend more themselves on goods and services. Household and business spending can cause prices to rise until the supply of goods and services increases to meet the increased demand. Economists argue that this demand effect produces short-term price growth.
However, that is just the outlay side of the story. Federal spending in times of emergency often outstrips the government’s income, causing the government to borrow from private and public lenders to make up the difference. The Federal Reserve frequently helps to fund government deficits by buying this new government debt. That debt is then held by banks of the Federal Reserve System as assets, which these banks in turn lend out to households and businesses as private loans. Due to a completely legal banking practice called fractional reserve lending, a bank holding federal debt as an asset can create loans for households and businesses that, added together, are several times more than the amount of that asset.
It is this channel of federal spending to households and businesses that is more responsible for fueling inflation than the direct spending discussed above, though that, too, plays a role. For example, a $100 billion federal deficit that is funded by banks buying $100 billion in Treasury bonds can result in as much as $700 billion in private loans, once fractional reserve lending kicks in. Households use their loans for mortgages and credit card purchases, and businesses use their loans to expand their factories, buy new equipment, and hire more workers. If the funded deficits are small, little harm is done to the price system. However, significant and sustained, above- normal deficit spending can cause prices to rise far faster than that implied by the growth in private incomes, thus engendering more private borrowing to keep up with the increasing gap between private spending and private income.[2]
Economic theory predicts rapid increases in prices when demand increases suddenly due to above-normal increases in credit. That is, households expand their spending because credit is more affordable and more abundant. Of course, household demand can rise because household earned income increases, but that rarely results in dramatic growth in inflation. If a worker’s income rises because he or she is more productive, then that productivity could mean that goods are produced more efficiently, which could even lead to price decreases. Demand could grow because prices are lower. However, if productivity is unchanged and credit is more available and affordable, households will spend without the offset of productivity gains, and inflation can result.
Did this happen, and is there a case that deficits funded by the Federal Reserve caused credit to rise and inflation to result? Let’s walk through the required chain of events step by step.
Let’s first look at spending. Between 2019 and 2023, federal outlays outstripped revenues by an average of $2.2 trillion per fiscal year (FY). Adding up the deficits for FY 2020 through FY 2023 totals $8.8 trillion. Outside of wartime, no four-year period in U.S. history has seen deficits this large, either in nominal terms or as a percent of GDP. (See Figure 2.)[3]
Debt held by the public rose by almost the same amount over that period, $8.9 trillion.[4] These deficits then were funded by the public (banks, individuals, companies, and governments, principally foreign) through purchases of government bonds.
How did the banking system react to all these new Treasury securities? The total bank assets of all U.S. commercial banks grew by 25.4 percent in just two years, 2020 and 2021, of which securities held as assets increased by 42.8 percent. Over the period 2021 to 2022, consumer loans grew by 19.2 percent, real estate loans grew by 12.1 percent, and the total loans of the banking system grew by 13.7 percent. The last time there was such a jump in lending was in 2005 and 2006, just prior to the Great Recession.[5]
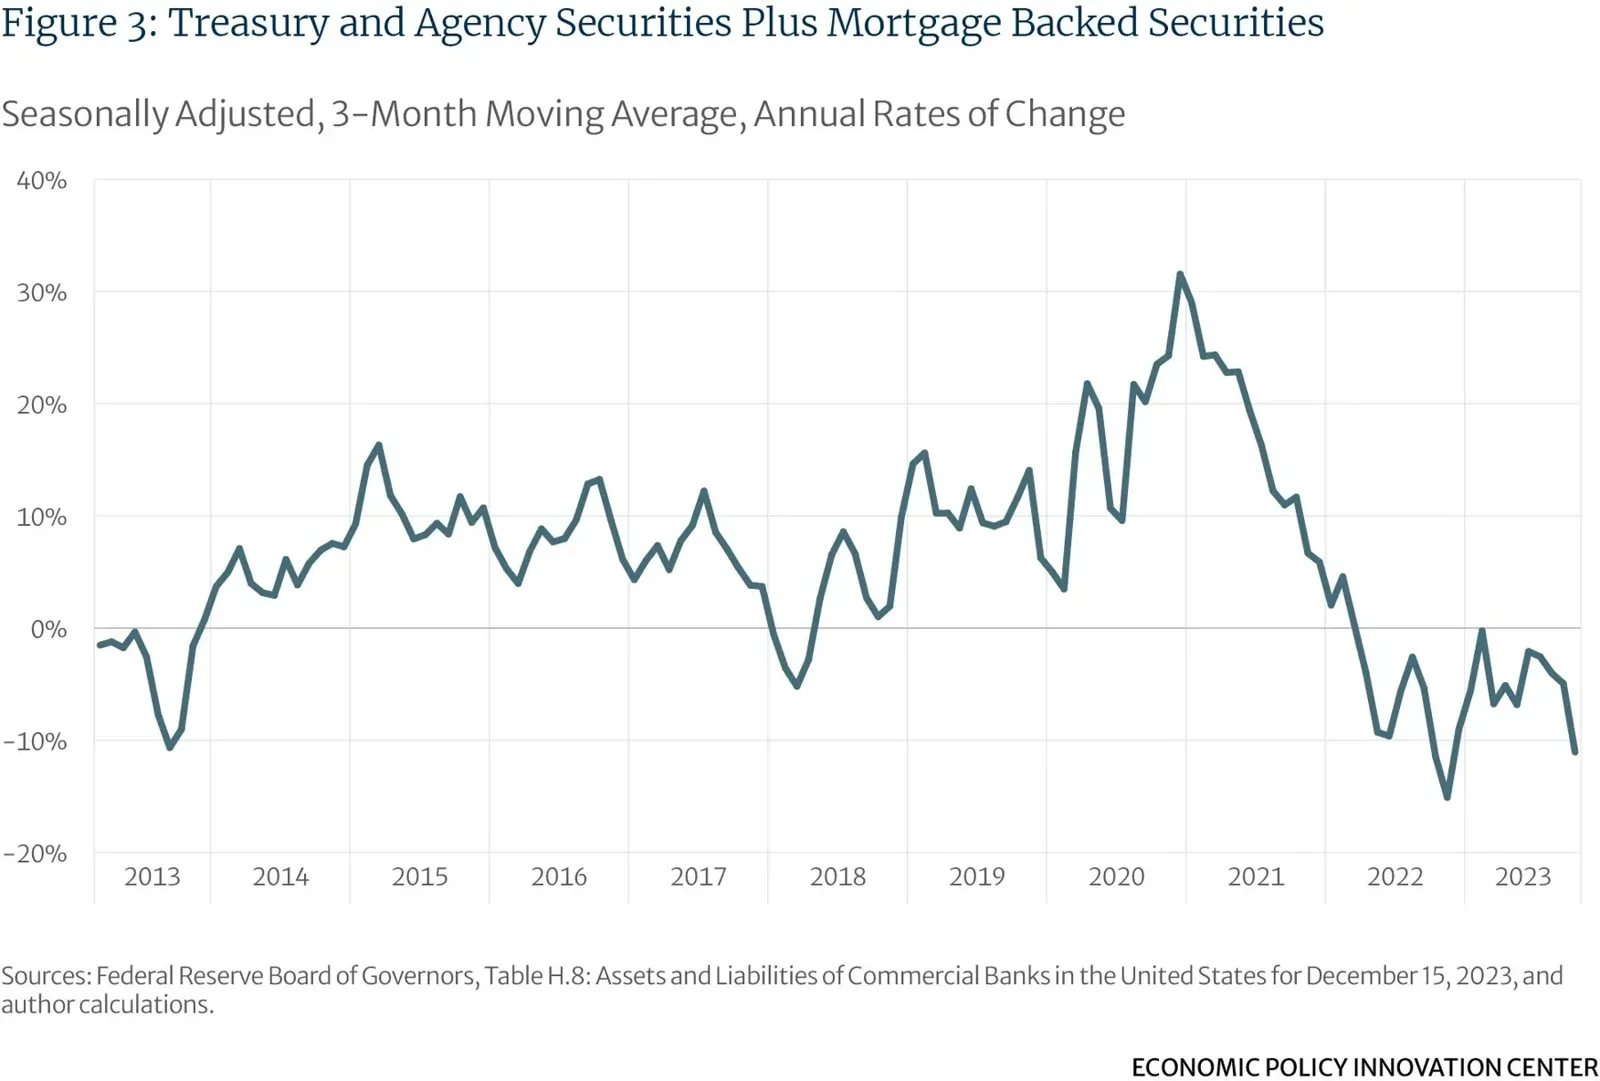 As Figure 3 shows, the three-month moving average of change in Treasury and agency security holdings grew dramatically at just the time when Congress was rapidly expanding the on-budget deficit. The growth in securities assets reached a peak change of 30 percent in October 2020 and was still growing by an annual rate of 10 percent a year later in September 2021.[6]
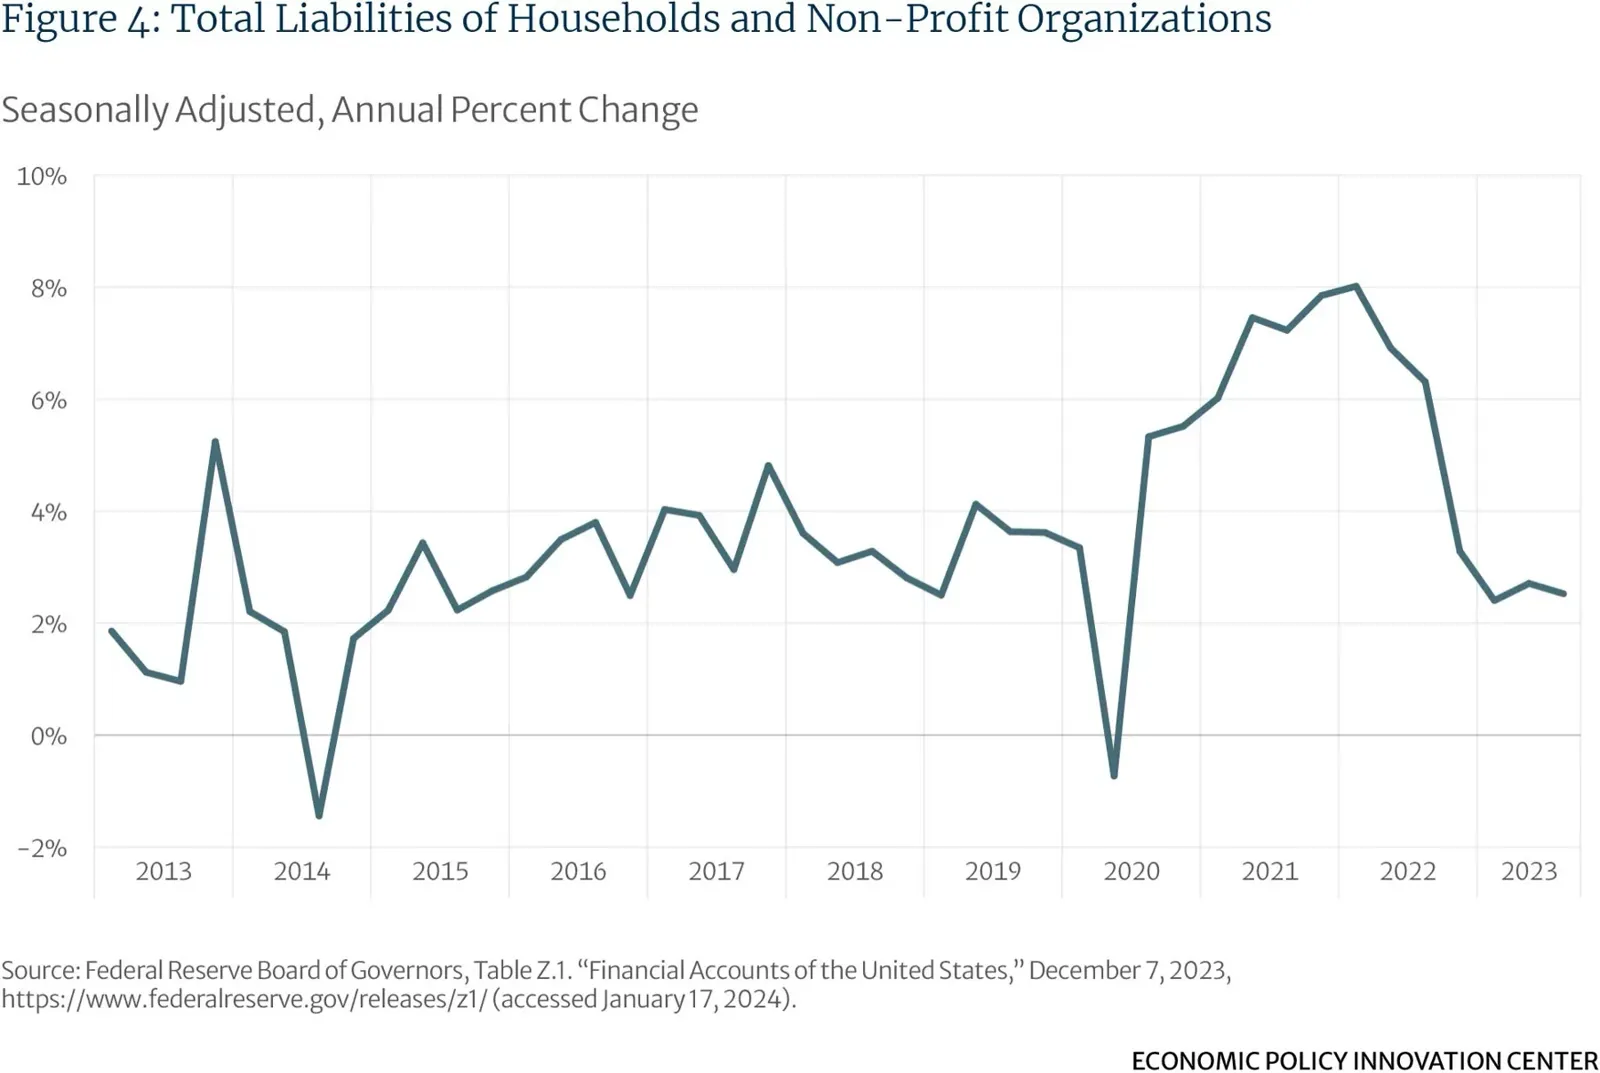
This expansion in assets resulted in a massive increase in bank credit in the summer of 2020, which continued to the summer of 2021. Banks extended this credit primarily to households and businesses.[7] Figure 4 shows the rapid growth in household liabilities during this same time period.
As Figure 3 shows, the three-month moving average of change in Treasury and agency security holdings grew dramatically at just the time when Congress was rapidly expanding the on-budget deficit. The growth in securities assets reached a peak change of 30 percent in October 2020 and was still growing by an annual rate of 10 percent a year later in September 2021.[6]
This expansion in assets resulted in a massive increase in bank credit in the summer of 2020, which continued to the summer of 2021. Banks extended this credit primarily to households and businesses.[7] Figure 4 shows the rapid growth in household liabilities during this same time period.
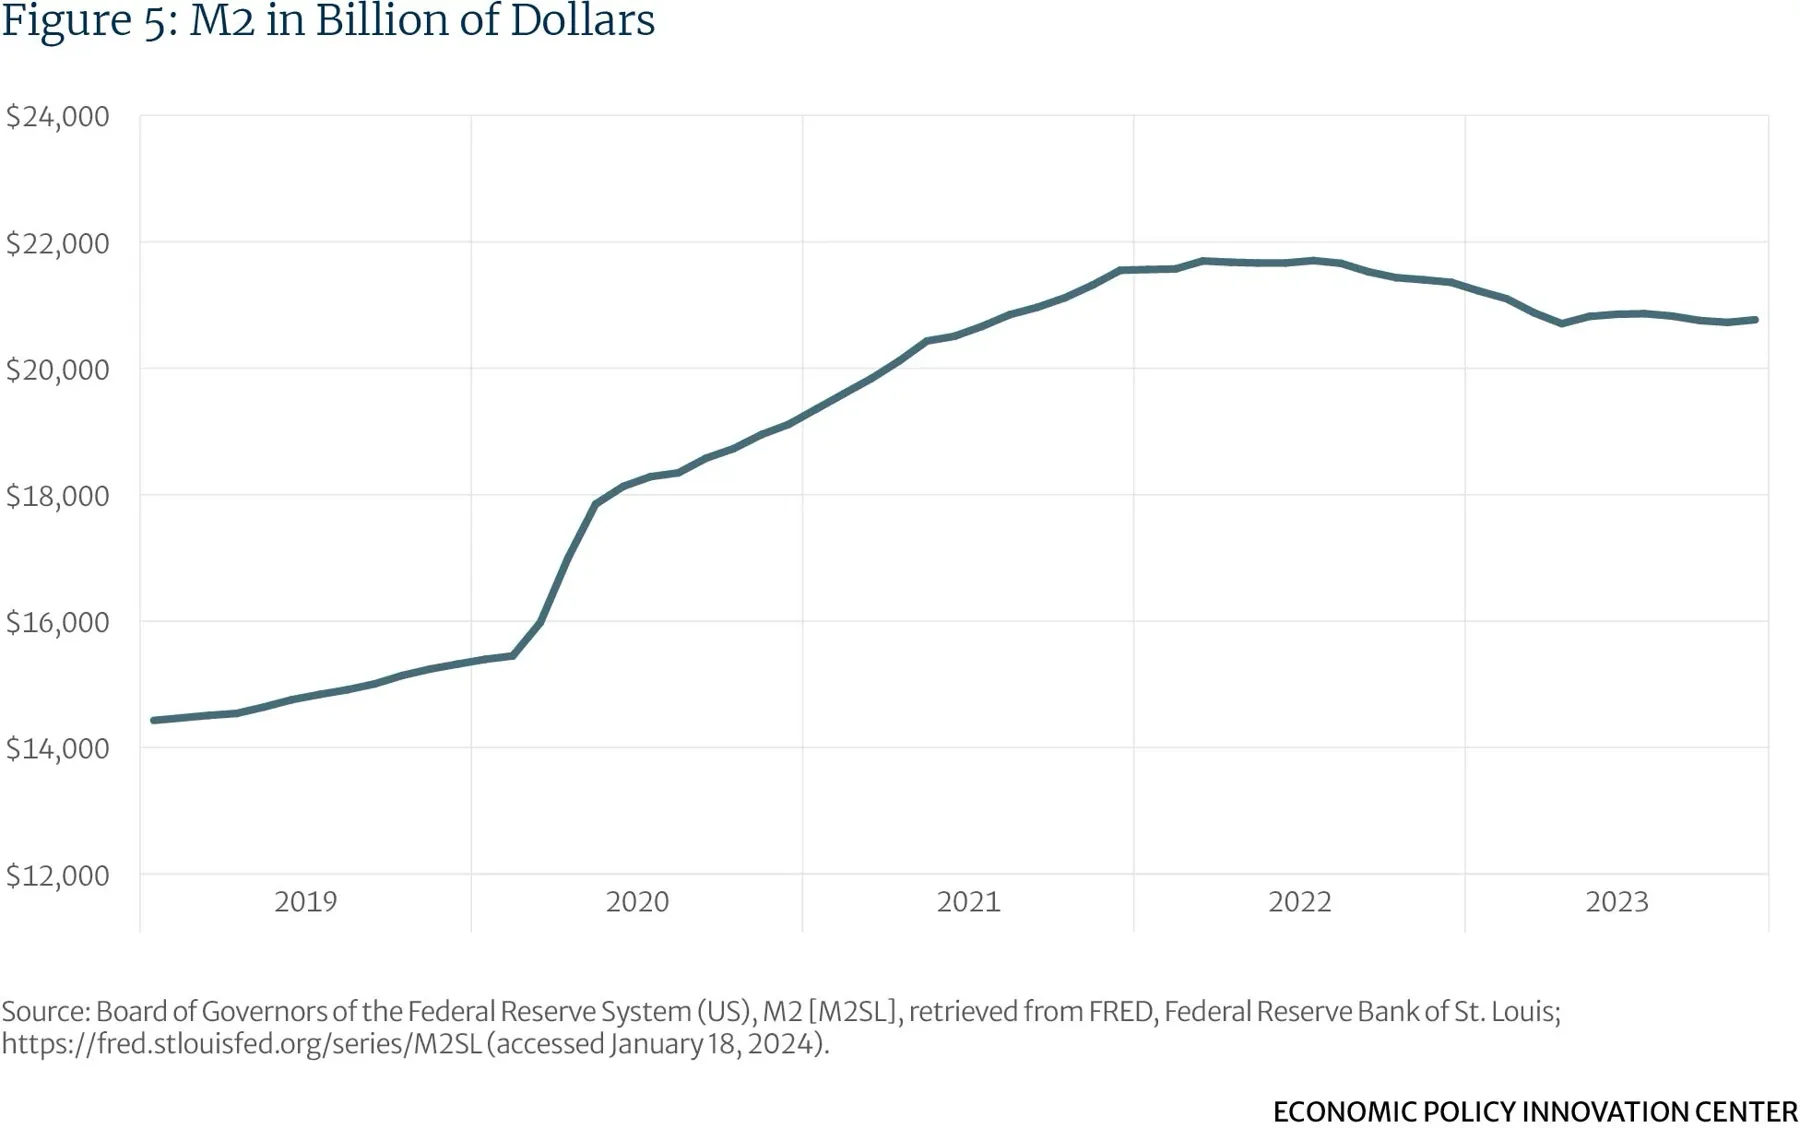
 While this lending activity by the commercial banking system turned into increases in aggregate demand, the Federal Reserve did little to counteract this potential source of inflation. In fact, the Fed rapidly expanded the money supply, which added more support for growth in demand. For example, the broad measurement of the money supply, M2, which includes credit as well as circulating money, grew by $5.4 trillion over March 30, 2020, through April 18, 2022—about a third of GDP. In fact, the Fed held more than half of the new federal debt issued from March 2020 in its own balance sheet as support for the growth in the money supply.[8] Figure 5 shows the dramatic increase in M2.
 If increases in federal debt can be held in the banking system but not lent to households and businesses or monetized by the Fed, there is less chance of inflation occurring immediately. This is what happened to the debt surge in 2009 and 2010, when the Federal Reserve paid banks a higher interest rate for not creating loans out of the banking system’s new assets than they would have realized through new loans.[9]
However, that did not happen in 2020 and 2021. The Federal Reserve purposefully accommodated the deficit spending and did not insulate the growth of assets from becoming loans. Why did the Federal Reserve do this? It acted intentionally, believing that the U.S. economy needed to be stimulated to avoid harmful deflation. Recovery from the pandemic demanded growth in the economy.
If increases in federal debt can be held in the banking system but not lent to households and businesses or monetized by the Fed, there is less chance of inflation occurring immediately. This is what happened to the debt surge in 2009 and 2010, when the Federal Reserve paid banks a higher interest rate for not creating loans out of the banking system’s new assets than they would have realized through new loans.[9]
However, that did not happen in 2020 and 2021. The Federal Reserve purposefully accommodated the deficit spending and did not insulate the growth of assets from becoming loans. Why did the Federal Reserve do this? It acted intentionally, believing that the U.S. economy needed to be stimulated to avoid harmful deflation. Recovery from the pandemic demanded growth in the economy.
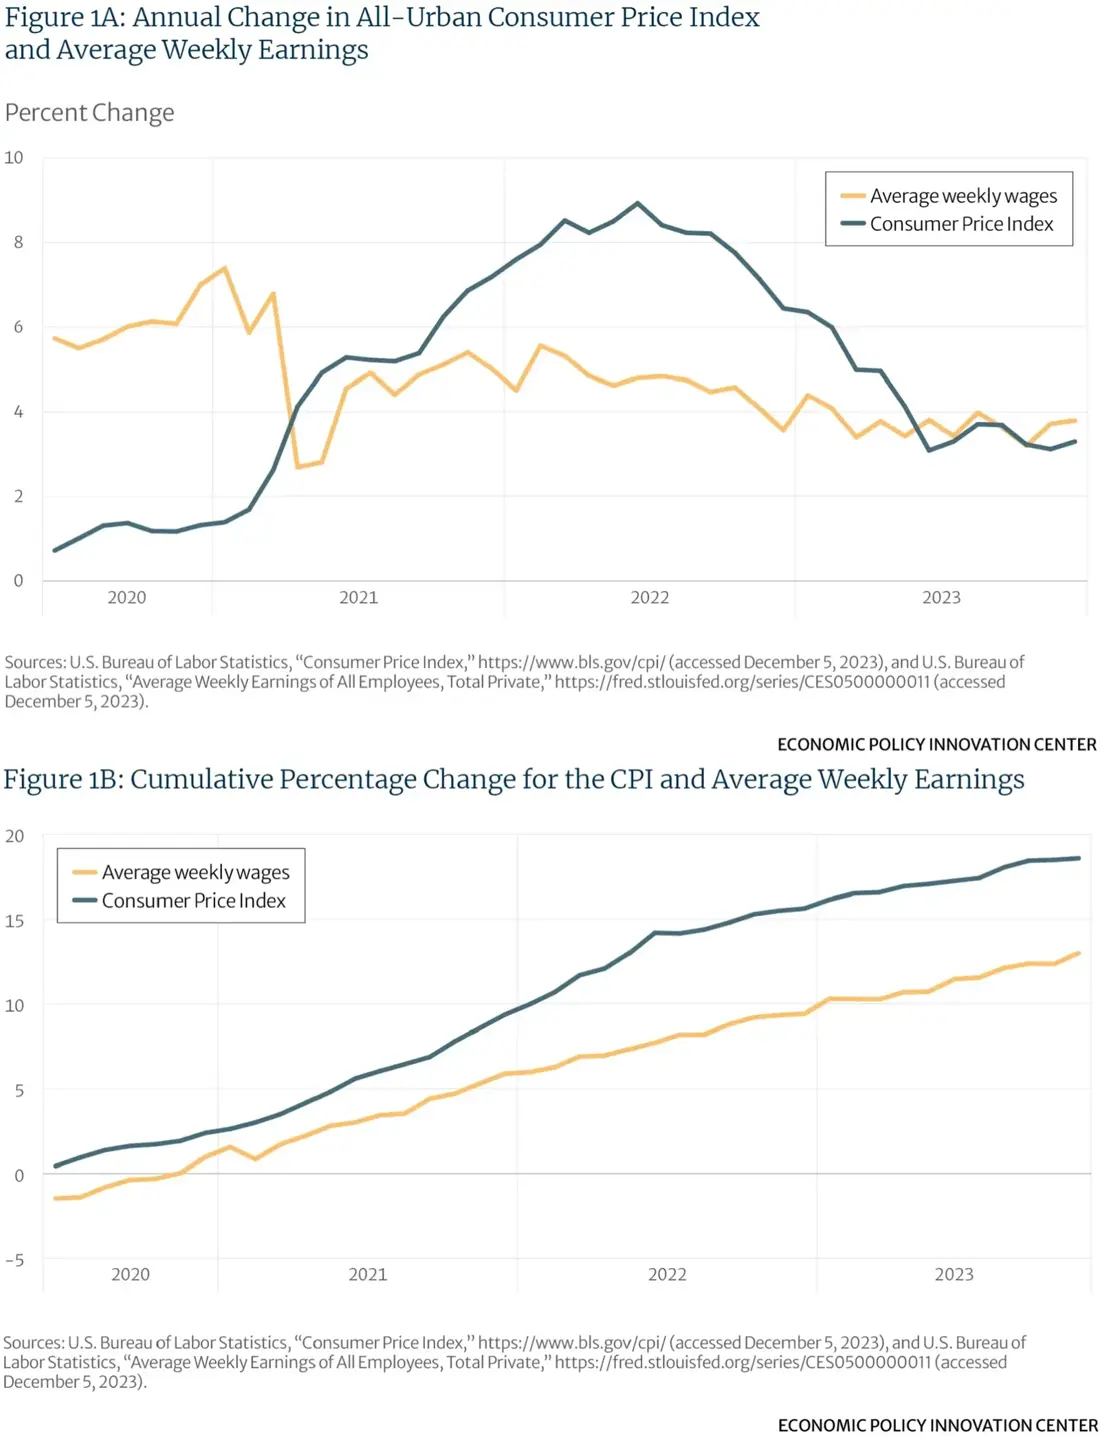
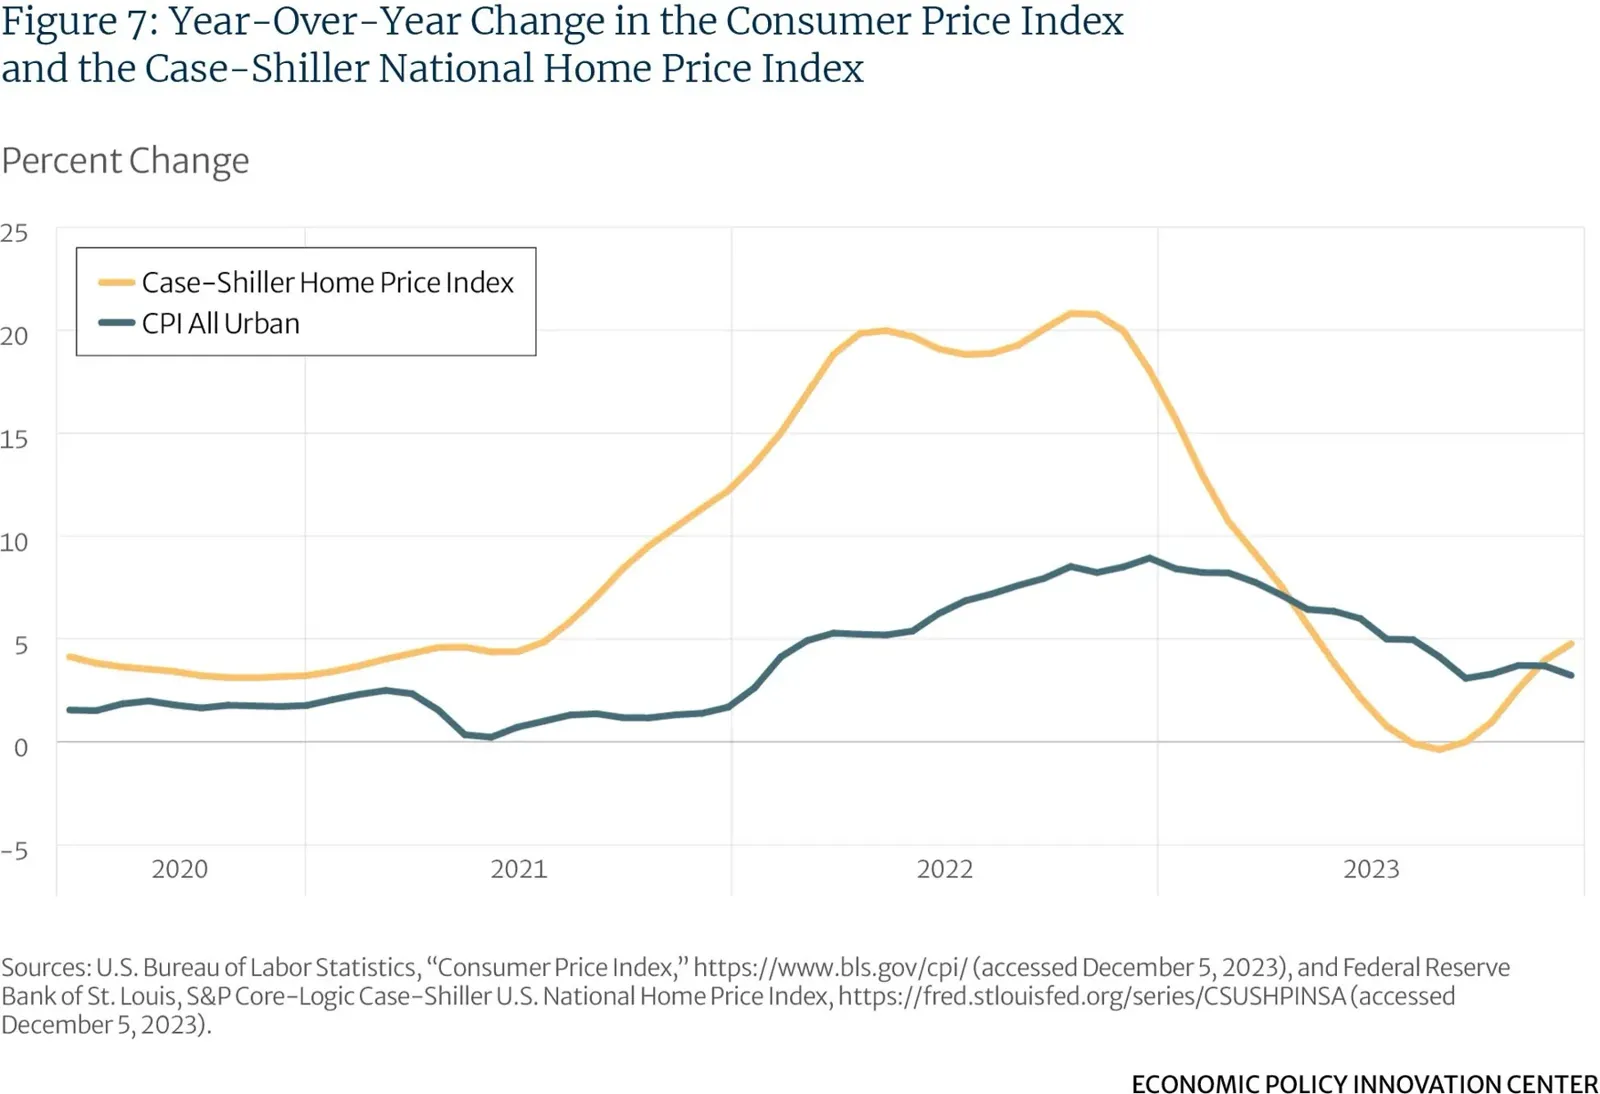
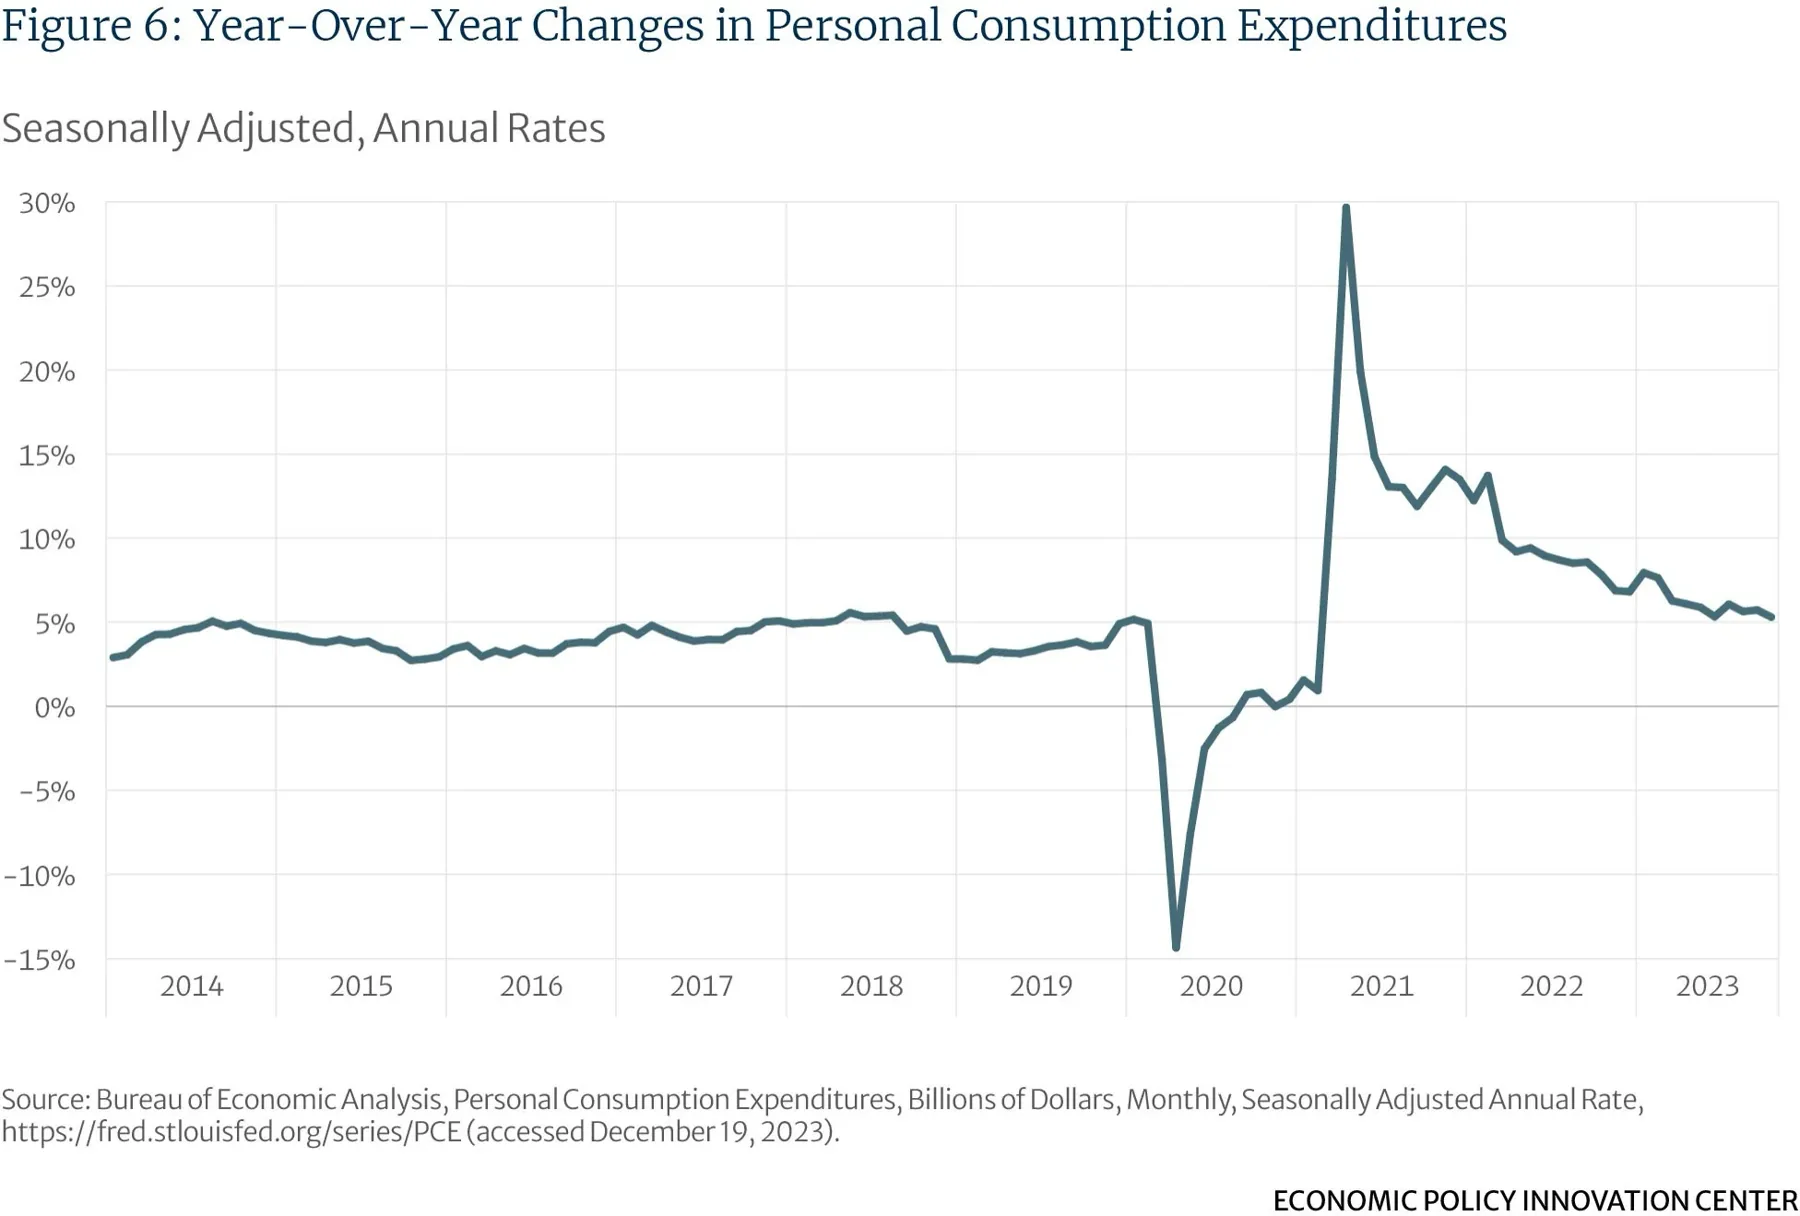 As a result of unprecedented deficit spending and financial accommodation of these deficits by the Federal Reserve, nearly historic inflation occurred. From June 2020 (largely viewed as the beginning of the recovery from the economic collapse of April 2020) through October 2023, overall prices in urban areas grew by 19.7 percent. In other words, average prices are up nearly one-fifth in just three years. Over that same time period, food prices rose by 21 percent, prices for meat and poultry products grew by 15 percent, and shelter prices increased by 19 percent in the CPI-U.[10] The Case-Shiller index, a sensitive metric for new and used home sales, increased by 43 percent.[11] From new cars to butter, prices rose starting in the summer of 2021 by rates nearly as high as the great inflation of 1979 through 1982.
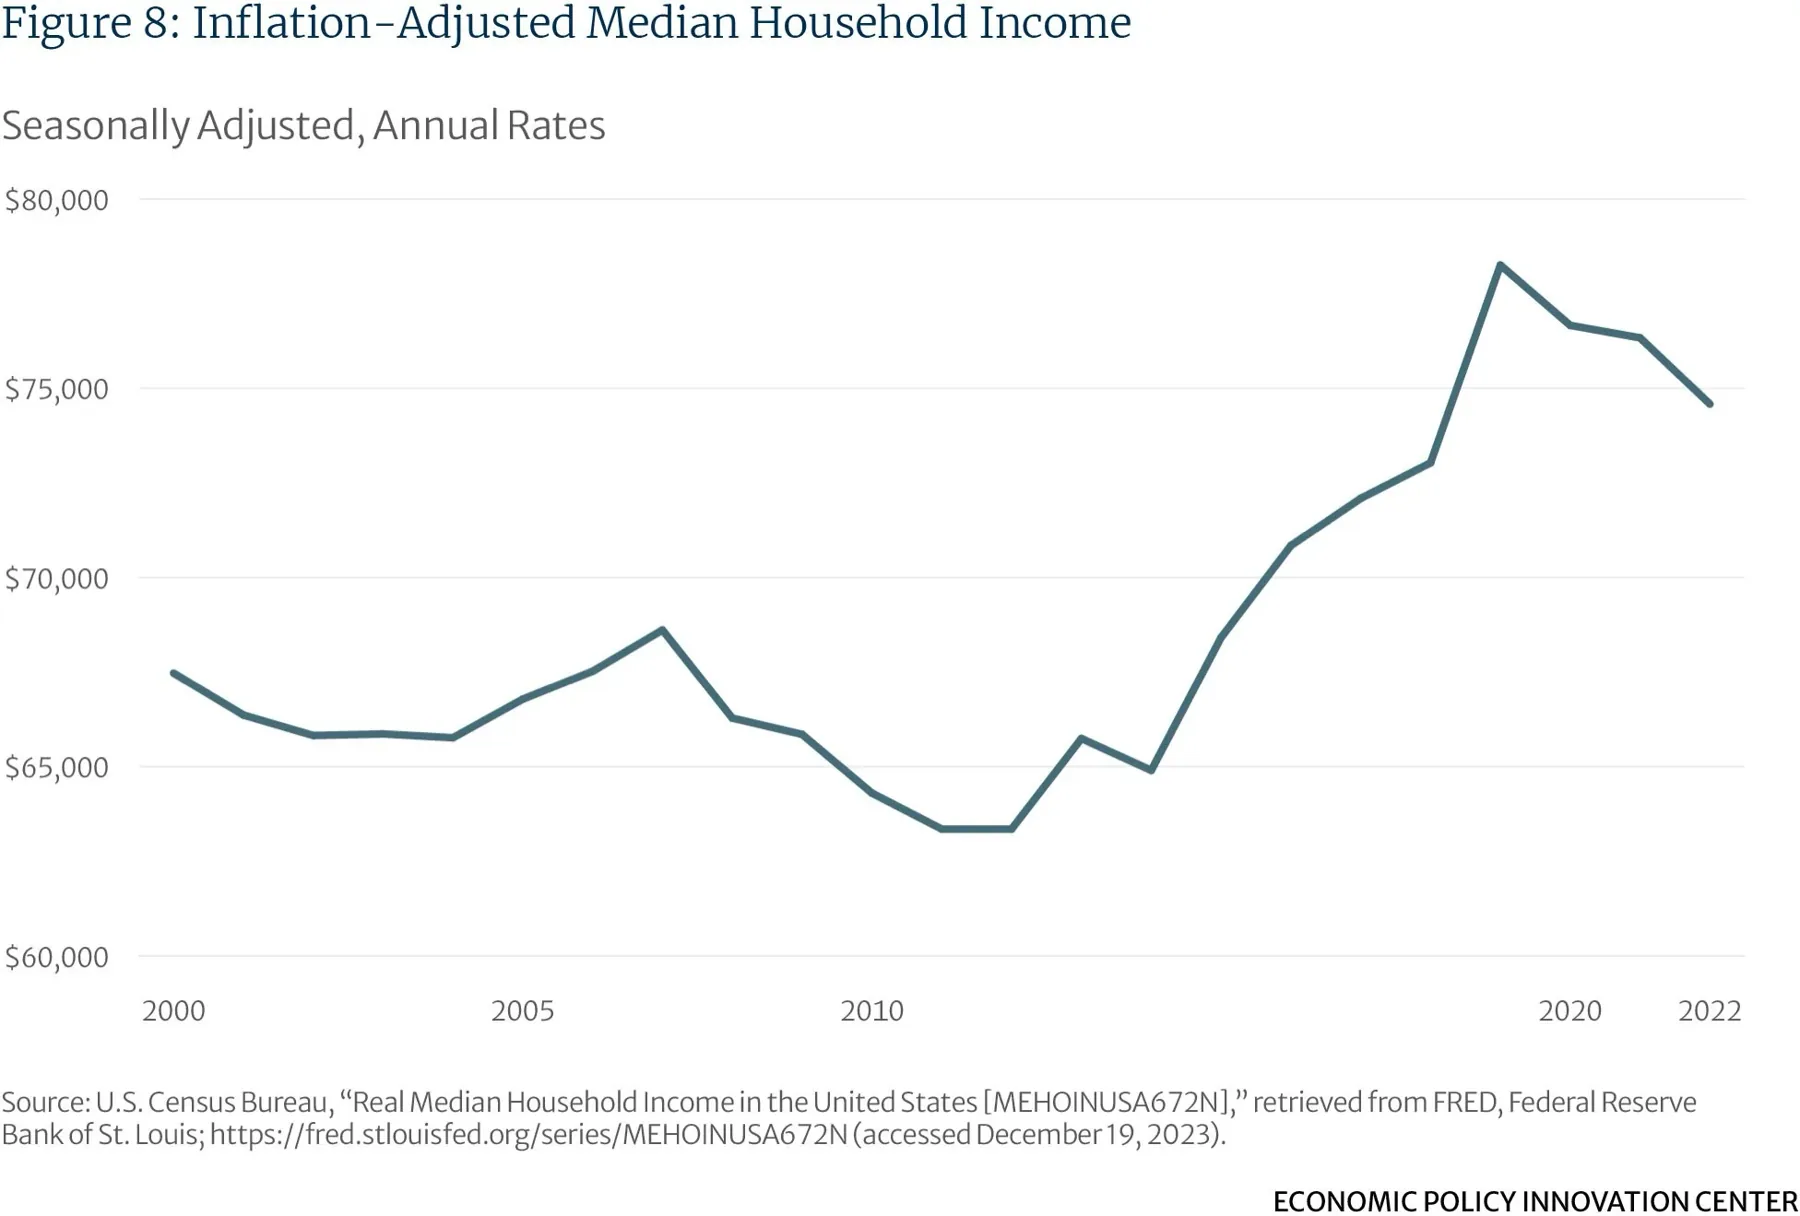
 At the same time, median household incomes did not keep pace with price growth. In fact, the median income fell, after adjusting for inflation. From 2019 through 2022, this annual estimate declined by 4.7 percent.[12],” retrieved from FRED, Federal Reserve Bank of St. Louis; https://fred.stlouisfed.org/series/MEHOINUSA672N (accessed December 10, 2023).] Being a median value, half of the income distribution did worse, and half did better than this estimate, but very few households kept up with inflation. Part of this decline can be attributed to the way the pandemic stalled economic activity in 2020. That said, the declines of 2021 and 2022 have more to do with the uneven recovery, especially those in the bottom half of the income distribution (young families, retirees, those stuck in intergenerational poverty), and the slowing effects of inflation on the pace of economic growth.
 Some analysts will object to connecting inflation with deficits because economies coming out of severe downturns in economic growth often experience high demand and insufficient goods to buy. For instance, the inflation following World War II could be viewed as a result of too many buyers chasing too few goods. So, why not view the inflation of 2021 and 2023 as a similar case?
The truth is that both inflation episodes are, indeed, highly similar, since the postwar economy also experienced massive increases in credit from equally massive wartime deficit spending.[13] The summer and fall of 2020 saw a general re-opening of the economy and a rapid increase in demand. No doubt prices for goods and services rose during those months because of insufficient supplies. That said, production quickly recovered, and most supplies returned to their 2019 levels by late 2020. However, just as the postwar economy was also stimulated by high levels of bank assets and record levels of lending, the late 2020 and early 2021 economy experienced credit infusions that raised aggregate demand beyond what would be required to return consumption to its pre-pandemic levels. Indeed, inflation-adjusted GDP had fully recovered by the first quarter of 2021, and nominal GDP was back a quarter earlier.[14],” retrieved from FRED, Federal Reserve Bank of St. Louis; https://fred.stlouisfed.org/series/GDP (accessed December 19, 2023).]
Others argue that deficits do not matter when considering inflation, because price growth stems from supply bottlenecks and from greedy, price-gouging producers. These critics basically argue that inflation is not a supply-and-demand phenomenon. Some of these skeptics hail from an approach to public finance called Modern Monetary Theory (MMT). The MMT economists argue that deficits can grow as large as necessary when fighting downturns in the economy. This is possible because the U.S. dollar is the reserve currency of the world, and the demand for U.S. currency does not appear to have an upper limit. Everyone, in other words, trades in U.S. dollars and holds vast reserves of U.S. currency to conduct international trade.
Prior to the latest round of explosive inflation, MMT attracted considerable attention in policy circles. That said, the fatal flaw of this approach is how completely it discounts the responsiveness of aggregate demand to changes in the monetary base. If, as happened in the monetary growth of 2008 through 2010, the Federal Reserve had insulated the growth in the banking system’s assets from conversion to retail and commercial loans, there might have been no serious inflation. However, bottling up asset growth today only delays the growth of loans sometime in the future, since at some point the Federal Reserve will make moves for higher rates of economic growth, thus releasing billions of assets into the banking system. Inflation always stems from growth in the supplies of money and credit; and, as history shows, and as this most recent episode demonstrates, the core cause of sudden growth in money and credit is higher levels of deficit spending.
Ignoring the sudden growth in aggregate demand also undermines the argument that sustained inflation is due to supply chain disruptions or price gouging. Clearly, supply chain problems can raise prices in the short term. This phenomenon was evident during the pandemic when new automobile production fell due to plant closings all along the production supply chain, thus raising the prices of used vehicles to unprecedented levels. However, supply chain issues always resolve themselves in a competitive economy. The high prices draw resources into the production of the high-priced product, which acts to reduce supply shortages and stabilize prices. That is precisely what happened in the automobile industry here and in foreign economies.
Price gouging also occurs during periods of severe product shortages. This is most famously the case during weather emergencies. Shipments of fuel and food into weather-affected areas are disrupted, which gives those who own supplies an opportunity to demand high prices for their products. However, that, too, is a short- lived market problem. Prices fall back to competitive levels when supplies are restored.
Economics, unlike physics, is not an exact science. We need always to be open to unique circumstances and unexpected results. That said, theory, history, and recent events point very clearly to a powerful nexus between excessive and sustained deficit spending and rapid increases in overall prices. This record also points to the responsibility that policymakers uniquely bear for worsening living conditions and for widespread pessimism about the economic future among the citizens they serve. High and sustained inflation undermines the economic and social fabric of a country, and will continue to do so in a predictable fashion if policymakers count their political aspirations facilitated by higher spending as more important than the goals and living standards of their constituents. When that happens, just as predictably, voters will find fault with these same policymakers and demand change through political or other means.
Which leads us back to the dismal view of the current economy. Among the most closely watched indicators of voter mood is the Index of Consumer Sentiment. The University of Michigan has been publishing the index since November 1952. The index surveys how happy people are with the economic world they inhabit at all age and income levels. The news: There has been a sea change in happiness—for the worse—since February 2021, and it is largely due to inflation.
The Index of Consumer Sentiment registered a brilliant 101 reading in February 2020, the month prior to the pandemic, in the United States. The index had reached or exceeded the 100 level 57 times since 1952.[15] However, it has not hit 100 since February 2020. A reading below 70 is viewed as a warning signal for policymakers, a flashing yellow light. Before March 2020, when the lockdowns began, the index hit 70 or below 73 times—about 12 percent of the published months between January 1952 and March 2020 (which included the worst period of inflation since World War II: 1979 to1982). From March 2020 to the present, the index has been at or below 70 a total of 23 times— 51 percent of the 45 months since February 2020.
Despite a seemingly steady, if not strong, economy as shown by the traditional metrics (such as the unemployment rate and GDP growth), the index is lower today, at 61.3 percent, than it was in January 2023. Indeed, the index has indicated broadening unhappiness with the economic situation since the summer of 2021, or just about the time the Consumer Price Index began its nearly historic rise.[16] Worse still, a University of Michigan companion survey on what the future looks like, the Index of Consumer Expectations, stands lower, at 56.8 percent, than the Index of Consumer Sentiment’s overall average of 61.3 percent.
Just as Congress “holds the pen” on principal responsibility for the length and severity of the current inflation, it also holds the cure. Prices will not likely fall back to their early 2020 levels, but rapidly growing incomes caused by increased worker productivity would go a long way toward relieving financial stress in households. When incomes are rising as fast or faster than price growth, consumer confidence turns up, not down. Congress can help to jump-start the growth in productivity through reforms to the tax code, to regulations, and to international trade rules. It also can signal its commitment to lower, or to no, deficits by reforming the processes by which it builds its budgets and by reforming the mandatory spending programs that do so much to increase the national debt.
Legislative and policy moves like this would most likely ensure a future in which disastrous, sustained inflation plays little, if any, role.
Some analysts will object to connecting inflation with deficits because economies coming out of severe downturns in economic growth often experience high demand and insufficient goods to buy. For instance, the inflation following World War II could be viewed as a result of too many buyers chasing too few goods. So, why not view the inflation of 2021 and 2023 as a similar case?
The truth is that both inflation episodes are, indeed, highly similar, since the postwar economy also experienced massive increases in credit from equally massive wartime deficit spending.[13] The summer and fall of 2020 saw a general re-opening of the economy and a rapid increase in demand. No doubt prices for goods and services rose during those months because of insufficient supplies. That said, production quickly recovered, and most supplies returned to their 2019 levels by late 2020. However, just as the postwar economy was also stimulated by high levels of bank assets and record levels of lending, the late 2020 and early 2021 economy experienced credit infusions that raised aggregate demand beyond what would be required to return consumption to its pre-pandemic levels. Indeed, inflation-adjusted GDP had fully recovered by the first quarter of 2021, and nominal GDP was back a quarter earlier.[14],” retrieved from FRED, Federal Reserve Bank of St. Louis; https://fred.stlouisfed.org/series/GDP (accessed December 19, 2023).]
Others argue that deficits do not matter when considering inflation, because price growth stems from supply bottlenecks and from greedy, price-gouging producers. These critics basically argue that inflation is not a supply-and-demand phenomenon. Some of these skeptics hail from an approach to public finance called Modern Monetary Theory (MMT). The MMT economists argue that deficits can grow as large as necessary when fighting downturns in the economy. This is possible because the U.S. dollar is the reserve currency of the world, and the demand for U.S. currency does not appear to have an upper limit. Everyone, in other words, trades in U.S. dollars and holds vast reserves of U.S. currency to conduct international trade.
Prior to the latest round of explosive inflation, MMT attracted considerable attention in policy circles. That said, the fatal flaw of this approach is how completely it discounts the responsiveness of aggregate demand to changes in the monetary base. If, as happened in the monetary growth of 2008 through 2010, the Federal Reserve had insulated the growth in the banking system’s assets from conversion to retail and commercial loans, there might have been no serious inflation. However, bottling up asset growth today only delays the growth of loans sometime in the future, since at some point the Federal Reserve will make moves for higher rates of economic growth, thus releasing billions of assets into the banking system. Inflation always stems from growth in the supplies of money and credit; and, as history shows, and as this most recent episode demonstrates, the core cause of sudden growth in money and credit is higher levels of deficit spending.
Ignoring the sudden growth in aggregate demand also undermines the argument that sustained inflation is due to supply chain disruptions or price gouging. Clearly, supply chain problems can raise prices in the short term. This phenomenon was evident during the pandemic when new automobile production fell due to plant closings all along the production supply chain, thus raising the prices of used vehicles to unprecedented levels. However, supply chain issues always resolve themselves in a competitive economy. The high prices draw resources into the production of the high-priced product, which acts to reduce supply shortages and stabilize prices. That is precisely what happened in the automobile industry here and in foreign economies.
Price gouging also occurs during periods of severe product shortages. This is most famously the case during weather emergencies. Shipments of fuel and food into weather-affected areas are disrupted, which gives those who own supplies an opportunity to demand high prices for their products. However, that, too, is a short- lived market problem. Prices fall back to competitive levels when supplies are restored.
Economics, unlike physics, is not an exact science. We need always to be open to unique circumstances and unexpected results. That said, theory, history, and recent events point very clearly to a powerful nexus between excessive and sustained deficit spending and rapid increases in overall prices. This record also points to the responsibility that policymakers uniquely bear for worsening living conditions and for widespread pessimism about the economic future among the citizens they serve. High and sustained inflation undermines the economic and social fabric of a country, and will continue to do so in a predictable fashion if policymakers count their political aspirations facilitated by higher spending as more important than the goals and living standards of their constituents. When that happens, just as predictably, voters will find fault with these same policymakers and demand change through political or other means.
Which leads us back to the dismal view of the current economy. Among the most closely watched indicators of voter mood is the Index of Consumer Sentiment. The University of Michigan has been publishing the index since November 1952. The index surveys how happy people are with the economic world they inhabit at all age and income levels. The news: There has been a sea change in happiness—for the worse—since February 2021, and it is largely due to inflation.
The Index of Consumer Sentiment registered a brilliant 101 reading in February 2020, the month prior to the pandemic, in the United States. The index had reached or exceeded the 100 level 57 times since 1952.[15] However, it has not hit 100 since February 2020. A reading below 70 is viewed as a warning signal for policymakers, a flashing yellow light. Before March 2020, when the lockdowns began, the index hit 70 or below 73 times—about 12 percent of the published months between January 1952 and March 2020 (which included the worst period of inflation since World War II: 1979 to1982). From March 2020 to the present, the index has been at or below 70 a total of 23 times— 51 percent of the 45 months since February 2020.
Despite a seemingly steady, if not strong, economy as shown by the traditional metrics (such as the unemployment rate and GDP growth), the index is lower today, at 61.3 percent, than it was in January 2023. Indeed, the index has indicated broadening unhappiness with the economic situation since the summer of 2021, or just about the time the Consumer Price Index began its nearly historic rise.[16] Worse still, a University of Michigan companion survey on what the future looks like, the Index of Consumer Expectations, stands lower, at 56.8 percent, than the Index of Consumer Sentiment’s overall average of 61.3 percent.
Just as Congress “holds the pen” on principal responsibility for the length and severity of the current inflation, it also holds the cure. Prices will not likely fall back to their early 2020 levels, but rapidly growing incomes caused by increased worker productivity would go a long way toward relieving financial stress in households. When incomes are rising as fast or faster than price growth, consumer confidence turns up, not down. Congress can help to jump-start the growth in productivity through reforms to the tax code, to regulations, and to international trade rules. It also can signal its commitment to lower, or to no, deficits by reforming the processes by which it builds its budgets and by reforming the mandatory spending programs that do so much to increase the national debt.
Legislative and policy moves like this would most likely ensure a future in which disastrous, sustained inflation plays little, if any, role.