Testimony
Remarks before Congress by Dr. Bill Beach on "Reducing America’s National Debt: Rooting Out Federal Waste, Fraud, and Overregulation"
May 14, 2026 · William W. Beach, D. Phil.

President Biden’s American Rescue Plan Act (ARPA) created a $350 billion program called the Coronavirus State and Local Fiscal Recovery Fund (SLFRF). A significant motivating factor for establishing the SLFRF was to replace “lost” state and local tax revenue based on the assumption that these governments experienced a shortfall during the COVID-19 pandemic. However, state and local governments can also spend their allocations on infrastructure, as well as five other spending categories.
Based on the most recent available data, state and local governments have spent about $90 billion on revenue replacement and another $19 billion on infrastructure. According to the U.S. Government Accountability Office (GAO), “of the seven spending categories, revenue replacement provides recipients with the most flexibility in their use of SLFRF awards and streamlined reporting requirements, according to Treasury guidance.”
However, most state and local governments did not experience the anticipated revenue loss from the pandemic. State rainy day funds have doubled since 2020, and state and local revenues have increased by 24 percent. Meanwhile, state budgets increased in 2022 in real terms relative to any other year since 1979. This raises the question of what they are doing with their windfall from the federal government.
Figure 1. State and Local Job Creation as a Percentage of Total Job Creation
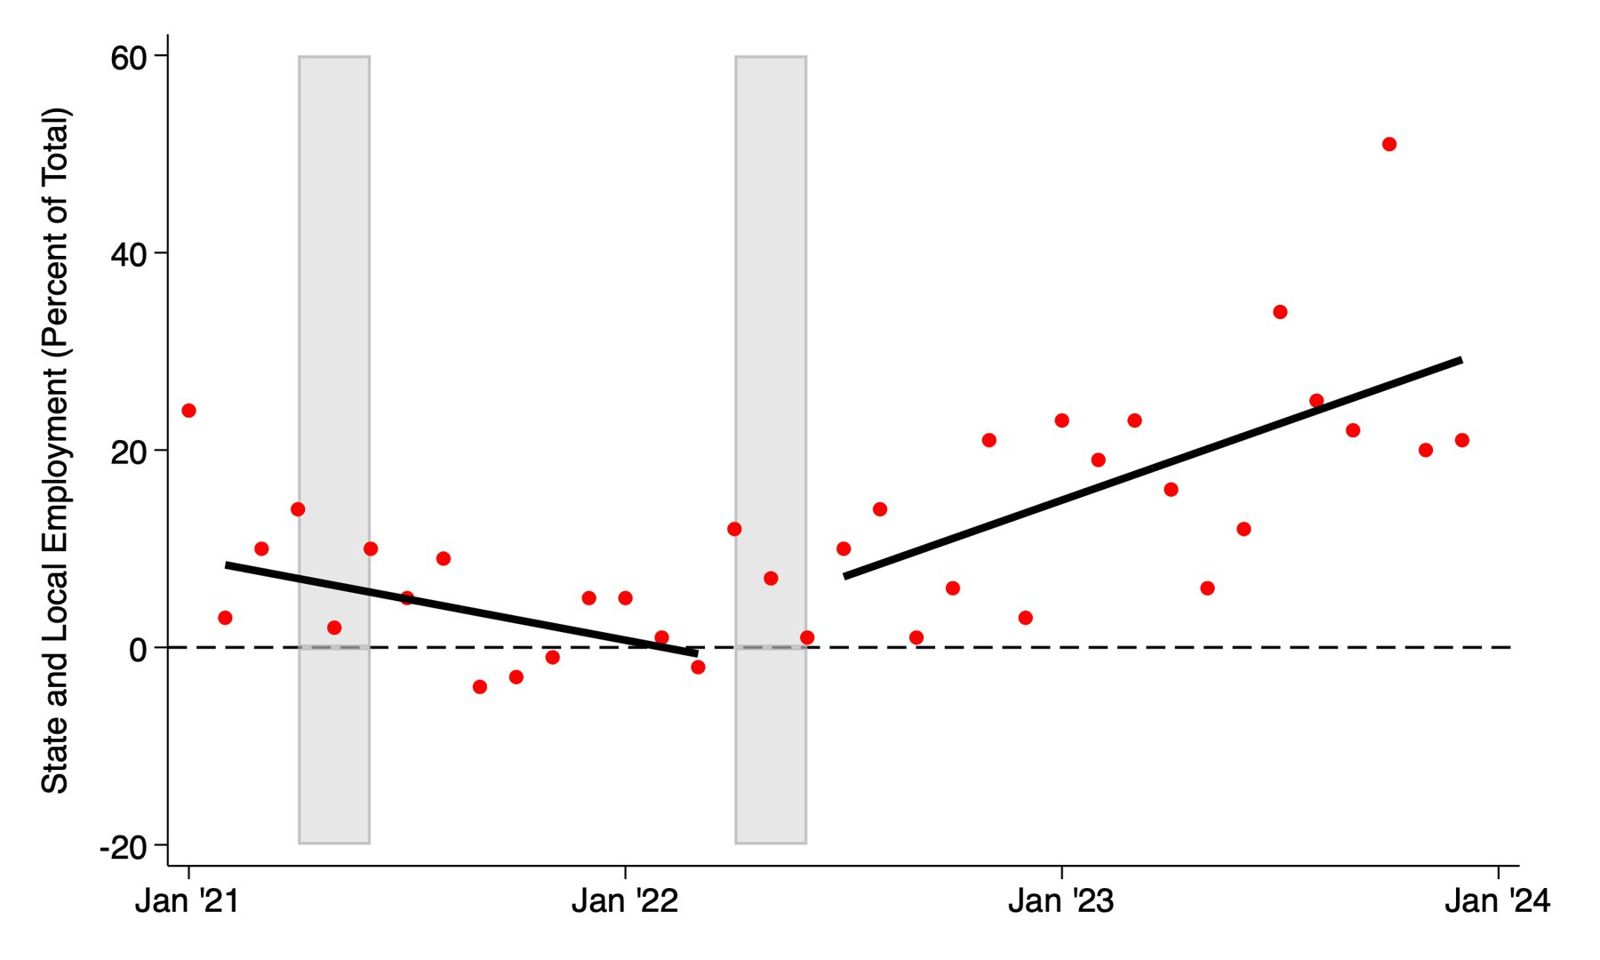
Note: The fitted lines reflect trends before and after the second SLFRF allocation was distributed to state and local governments. The period begins in January 2021, marking the beginning of the Biden Administration. The shaded areas in gray represent the major SLFRF allocations. The timing of these allocations can be derived using data from the Bureau of Economic Analysis.
Source: Author’s calculations using data from the Bureau of Labor Statistics and the Bureau of Economic Analysis.
They are growing. Since the last major SLFRF allocation was disbursed during the second quarter of 2022, 18 percent of the total jobs created in any given month have been by state and local governments. In 2023, a year of job creation that the White House has characterized as particularly strong, more than 22 percent of all jobs created were state and local government jobs.
This raises another question about what types of jobs are being created. Historically, public schools and universities have been major employers. Data on local education is collected from public school districts that are supported by taxes and are commonly county-based. State education encompasses all publicly funded post-secondary school and state technical programs. Both categories include all personnel from administrators to paid security.
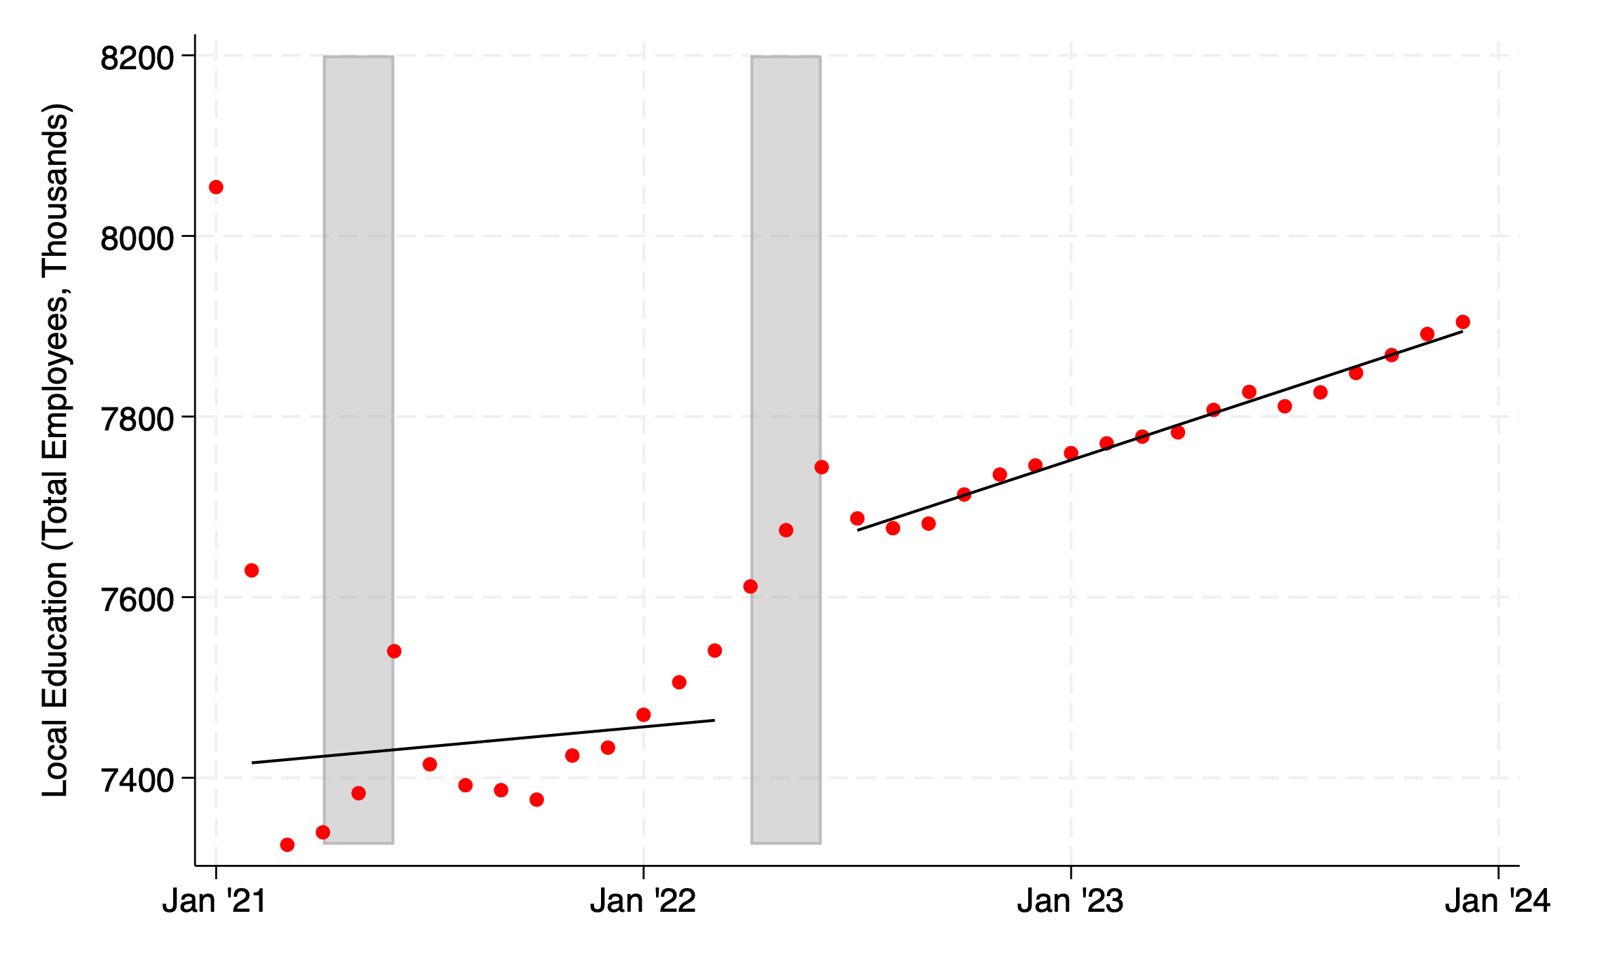
Figure 2. Employment in Local Education, 2021-Today
Source: Author’s calculations using data from the Bureau of Labor Statistics and the Bureau of Economic Analysis.
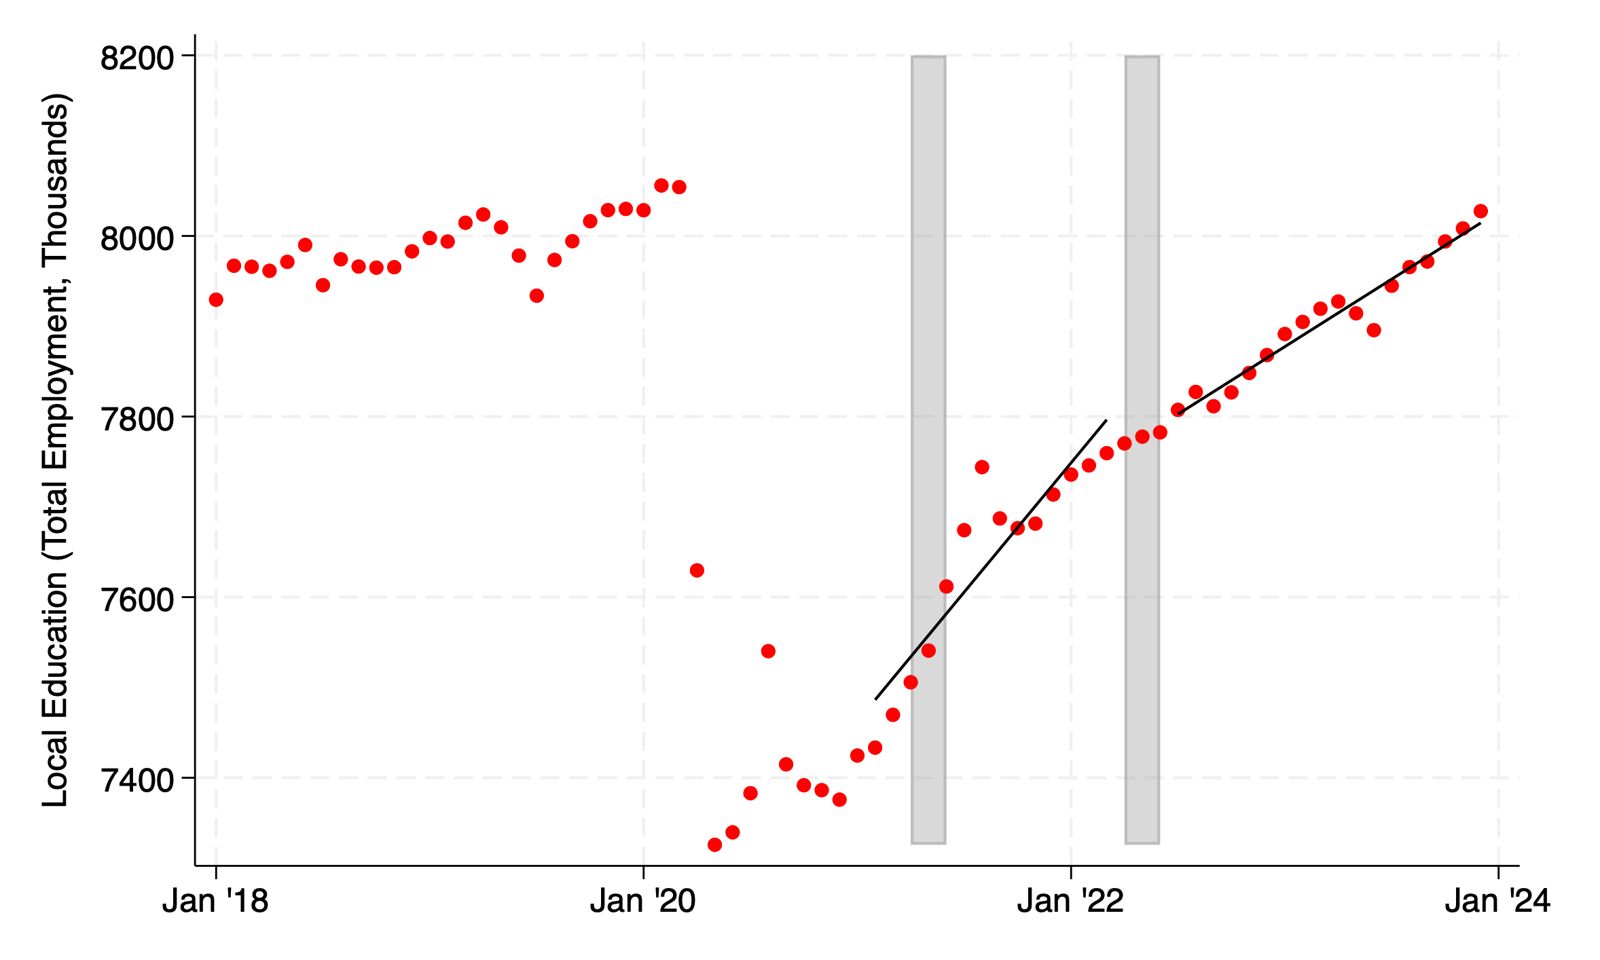
Employment in K-12 public schools is increasing. But this increase started well before the SLFRF funds were allocated and is more likely a response to local school districts returning to in-person instruction after the pandemic ended. Furthermore, total K-12 public school employment is still slightly below where it was before the pandemic began.
Figure 3. Employment in Local Education, 2018-Today
Source: Author’s calculations using data from the Bureau of Labor Statistics and the Bureau of Economic Analysis.
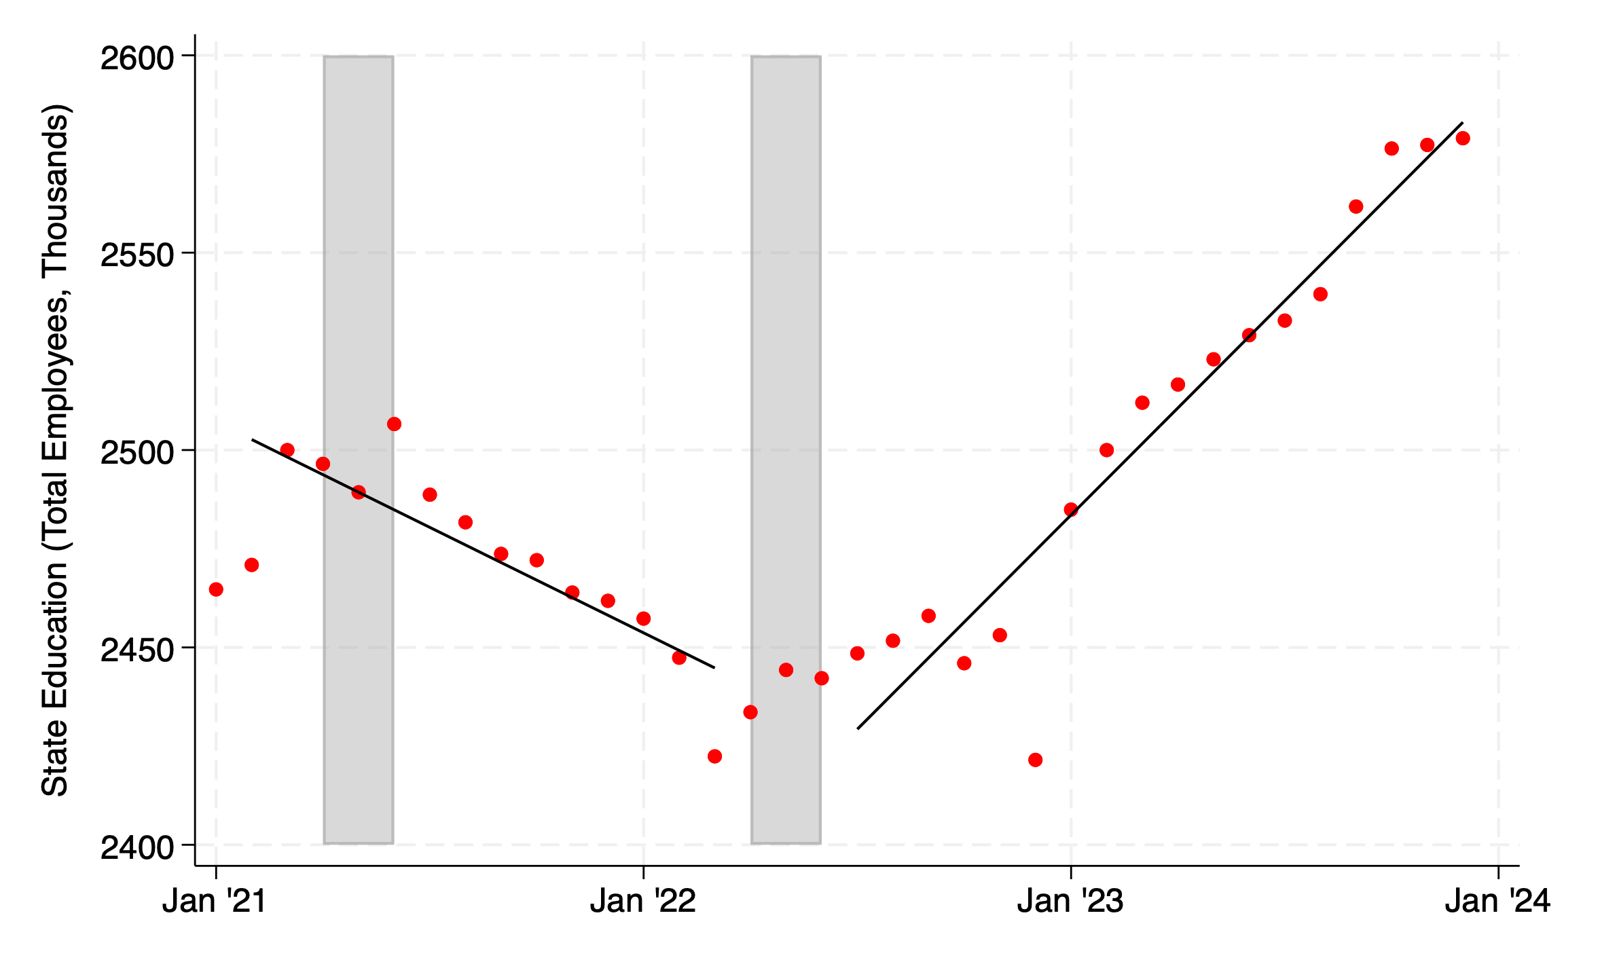
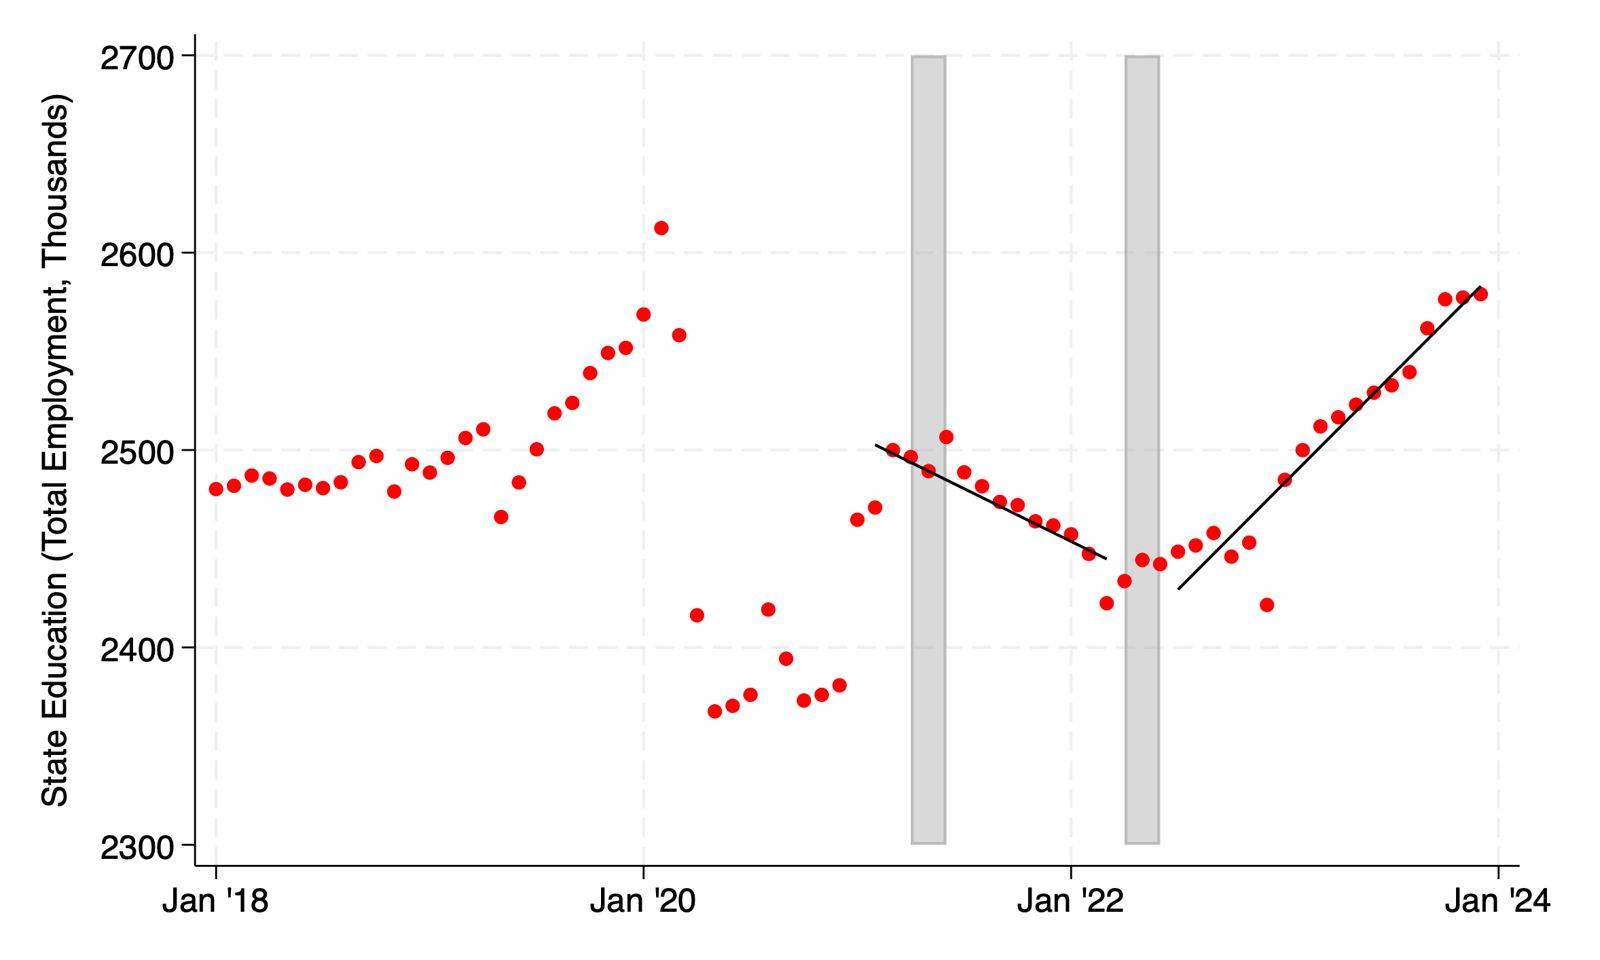
Employment in post-secondary and technical education is a slightly different story. Employment increased with a return to in-person instruction in 2021 but has increased considerably since the second quarter of 2022 when the last SLFRF allotment was distributed. It is now above its pre-pandemic level.
Figure 4. Employment in State Education, 2021-Today
Source: Author’s calculations using data from the Bureau of Labor Statistics and the Bureau of Economic Analysis.
Figure 5. Employment in State Education, 2018-Today
Source: Author’s calculations using data from the Bureau of Labor Statistics and the Bureau of Economic Analysis.
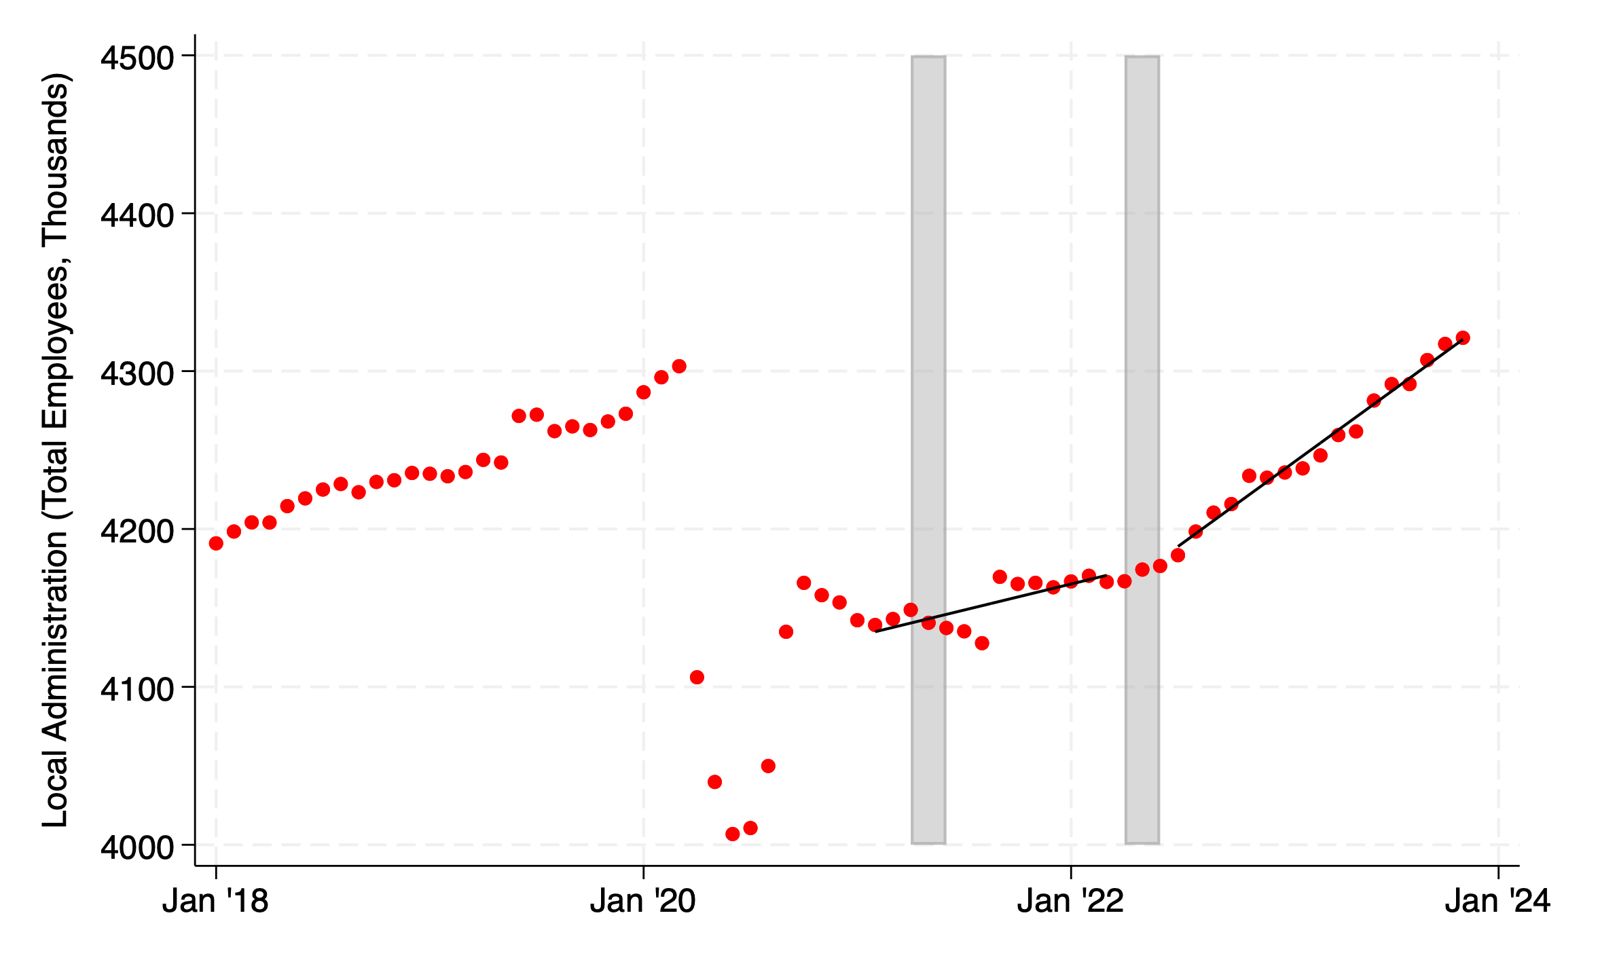
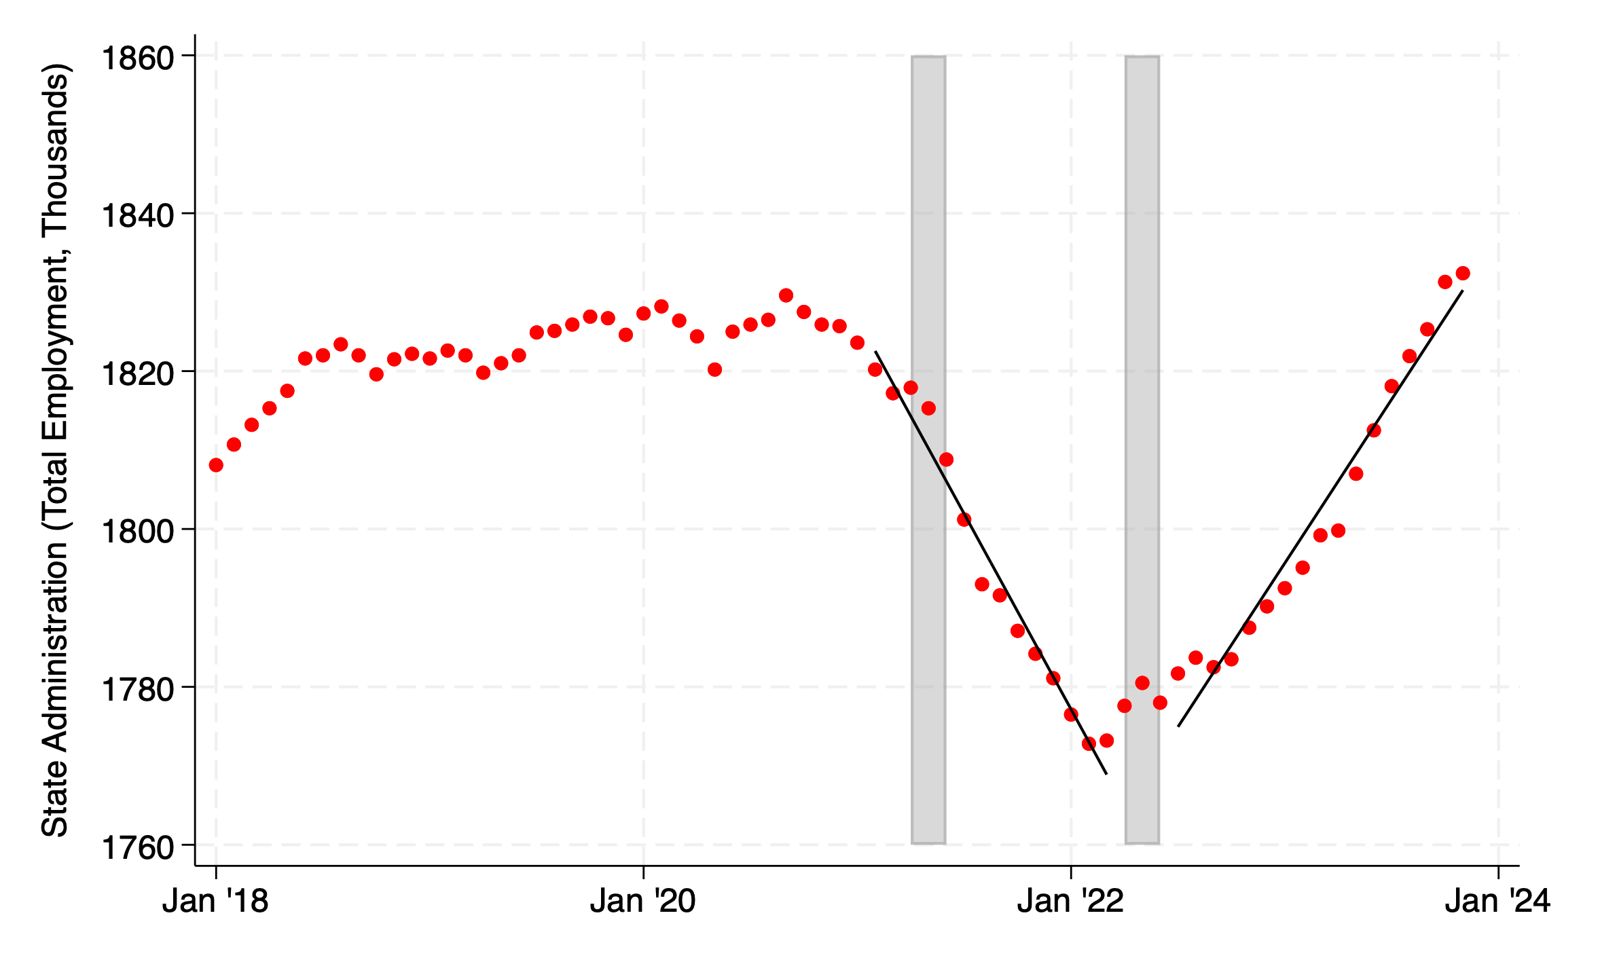
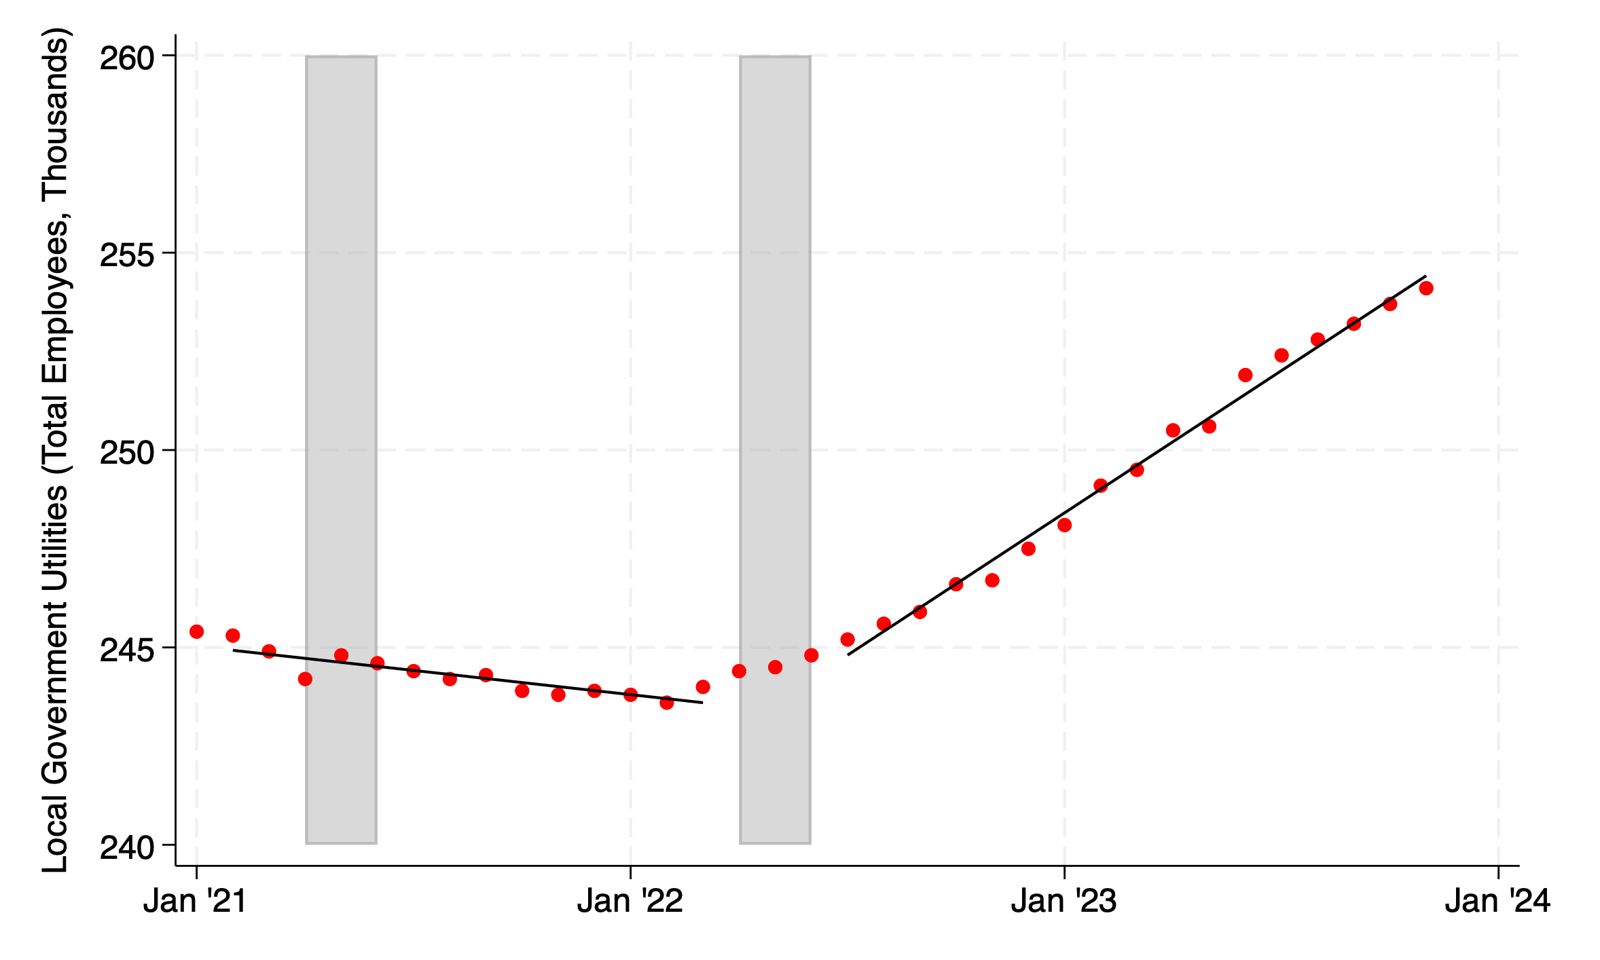
Another area that has seen gains in employment is state and local administration. Both have increased since the last SLFRF disbursement. However, employment in state administration has reversed from a decline since the middle of 2022. Today, employment levels are higher for both state and local government administration relative to where they were before the pandemic. Finally, employment in local utilities (e.g., water, broadband) has increased since the last SLFRF disbursement.
Figure 6. Employment in Local Administration, 2018-Today
Source: Author’s calculations using data from the Bureau of Labor Statistics and the Bureau of Economic Analysis.
Figure 7. Employment in State Administration, 2018-Today
Source: Author’s calculations using data from the Bureau of Labor Statistics and the Bureau of Economic Analysis.
Figure 8. Employment in Local Government Utilities, 2021-Today
Source: Author’s calculations using data from the Bureau of Labor Statistics and the Bureau of Economic Analysis.
How much of the job creation since 2021 is related to the SLFRF subsidies? Before the pandemic, state and local government payroll accounted for less than 10 percent of total jobs and about the same in the percentage of total jobs created each month. If the subsidies are responsible for all the job creation above the trend since they were disbursed (which is a conservative assumption), that amounts to about 384,000 to 432,000 jobs in state and local government created since 2022. In other words, this amounts to about $250,000 to $283,000 in federal taxpayer spending for each new job.
These figures raise significant questions about how dependent state and local governments are becoming on federal funding that was intended to help them recover from the pandemic.