

The Congressional Budget Office (CBO) published its annual Budget and Economic Outlook on February 7, this one for the fiscal years 2024 through 2034.[1] Budget wonks and economic forecasters consider this publication one of the truly red-letter days in their calendars. However, most Americans understandably have better ways of spending their time than pouring over financial and economic data.
That said, should the average citizen blithely pass this one by like most past CBO Outlooks? Is there any news in this year’s offering? Surprisingly, the answer is yes, and our worthy electorate should pay attention. Besides some crucial projections of price and interest rate changes that we will cover in a separate paper, CBO’s economic forecasts contain a stunning hat-tip to the large immigration flows of the past three years. Not only does most of the labor force grow across CBO’s 10-year projection window stem principally from net immigration, but the increases are so large that they affect nearly everything in the report from GDP to tax revenues and social infrastructure programs. Now, that’s news worth pondering.
CBO’s assumptions about large net immigration changes are important for one over-arching reason: the presence of more immigrants in CBO’s opinion offsets some of the economic bad news in the short run. The agency is calling for a significant slowdown in the growth of Gross Domestic Product (GDP) this year and next from the 3.3 percent pace of 2023: 1.5 percent in 2024 and 2.2 percent in 2025. Also, the unemployment rate is expected to grow this year to 4.4 percent from its year-end level of 3.7 percent in 2023. Net immigration adds 0.2 percent to the growth rate in both years, which makes the unemployment rate somewhat lower than it otherwise would be. That’s an addition to U.S. economic performance that continues throughout CBO’s 10-year Outlook window.
Demographics as Destiny
Reports on population trends often and sadly go underreported by the mainstream media. That was certainly the case when CBO published its revised population estimated on January 18 of this year.[2] Because net immigration (or the sum of people entering the country minus those leaving the country) has accounted for a large share of population and labor force growth for the past two decades, CBO always pays attention immigration. Thus, updates and changes to the agency’s population, fertility and mortality estimates are not new.
What is new is the change this year, starting with the January report. Last year’s report (2023) revised up the population in 2053 by 0.8 percent.[3] However, CBO revised up the population for this year’s end year, 2054, by 2.4 percent. The much larger change for the end year is driven by higher estimates of immigration for 2023 through 2025. In short, CBO recognized the enormity of recent immigration, documented and non-documented, since 2021; and, that substantial, multi-year influx is now affecting population estimates across the entire 30-year projection window.
Figure 1. Historical and CBO Projected Net Immigration Totals, 2009-2053
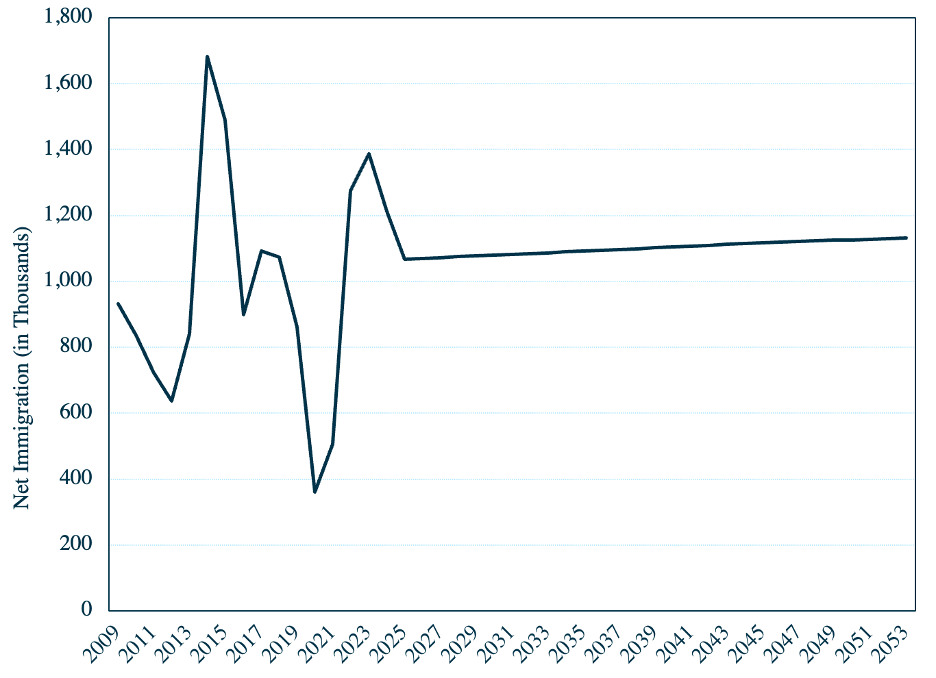
Source: Congressional Budget Office, The Demographic Outlook, 2024 to 2054 (January 18, 2024) at https://www.cbo.gov/system/files/2024-01/59697-Demographic-Outlook.pdf
Two other factors also contribute to the higher 30-year estimates. One, there are more births in the U.S. than previously projected simply because we are expected to have so many more people, even though CBO expected the average fertility rate to drop from 1.75 births per woman to 1.70 births by 2034.[4] Second, CBO projects fewer deaths through 2034 than previously, largely due to decreased estimated mortality in the short run from Covid-19.[5]
How do these population revisions enter the economic assumptions that CBO makes and that provide the foundation for important parts of the agency’s budget outlook?
- First, CBO has revised upwards its population growth estimate between 2024 and 2033 by 7.4 million more people aged 16 and above. That is an upward revision of 2.4 percent. About 80 percent of that 7.4 million (or 5.9 million) is due to net immigration. The rest is due to lower mortality estimates.[6]
- Second, the labor force grows more rapidly than previously expected. CBO now expects 5.2 million more people in the labor force by 2033, and most of that increase is coming from net immigration. These additions to the labor force are net increases after accounting for the millions who are leaving the labor force over that time period, largely because of retirement. CBO also expects these new laborers to be typically younger, thus lowering the average age of the prime-age workers (ages 24 to 55).[7]
- Third, the influx of so many immigrants in the short term increases the demand for goods and services across the entire forecast horizon. Thus, CBO expects this upwardly revised population to increase inflation-adjusted GDP by $552 billion in ten years over that forecasted last year. Indeed, each year of the forecast period grows by .2 of a percent greater than previously forecasted due solely to the greater-than-expected number of residents in the U.S. From a budgetary standpoint, that means more workers paying payroll taxes and income taxes, but it also implies more government outlays for schools, roads, and housing.
- Fourth, productivity initially slows down. Economic growth is all about the productivity of the economy. The incomes of workers and business owners increase when goods and services are produced more efficiently and at relatively lower cost. However, CBO expects the productivity of all inputs to decline in the short term as these greater numbers of immigrant workers, who have generally lower skill levels than their native-born counterparts, weigh down productivity. Indeed, we don’t return to our current productivity trend until 2027.[8]
There is a good deal to unpack here. On the one hand, the domestic labor force grows more rapidly than previously expected and, over time, adds to productivity. More mouths to feed implies greater output levels for goods and services, thus greater GDP growth. The tax base increases, and most of the new taxes are coming from younger workers who will have fewer than average claims on safety net programs.
On the other hand, new population places new pressures on our physical and social infrastructure. If net immigration continues at its recently high levels, we might need to rethink our budget priorities and shift resources away from older to younger populations. That shift would include more funding for worker training, family health and social services, as well as housing and education.
The assumptions analysts make about immigration matter a lot. The U.S. Census Bureau recently published its latest population projections through 2100. Its main projection has the U.S. population growing through the middle of this century before declining slightly through 2100. This central projection shows small gains for younger cohorts through 2050, and then a resumption of a dominant aging trend thereafter. However, an alternative scenario that assumes something close to the high pace of recent immigration shows steady population growth through 2100 and an increasingly youthful population throughout.[9] The U.S. Census Bureau also expects that this immigration may reverse the otherwise steady decline in the rate of natural increase (births minus deaths) by mid-century.[10] (See Figure 1)
Another perspective on our uncertain population future was recently provided by the United Nations (UN). The UN published new estimates for country populations in 2100, and demographers there expect most of the developed world to decline in absolute numbers between now and the end of the century. For instance, China’s population drops by 50 percent between now and then. However, the UN projects that the U.S. will grow between 50 and 100 million by 2100. Most of that growth will come from immigration and produce a more youthful population.[11]
Figure 2. Annual Change in U.S. Natural Increase and Net International Migration, 2017-2060
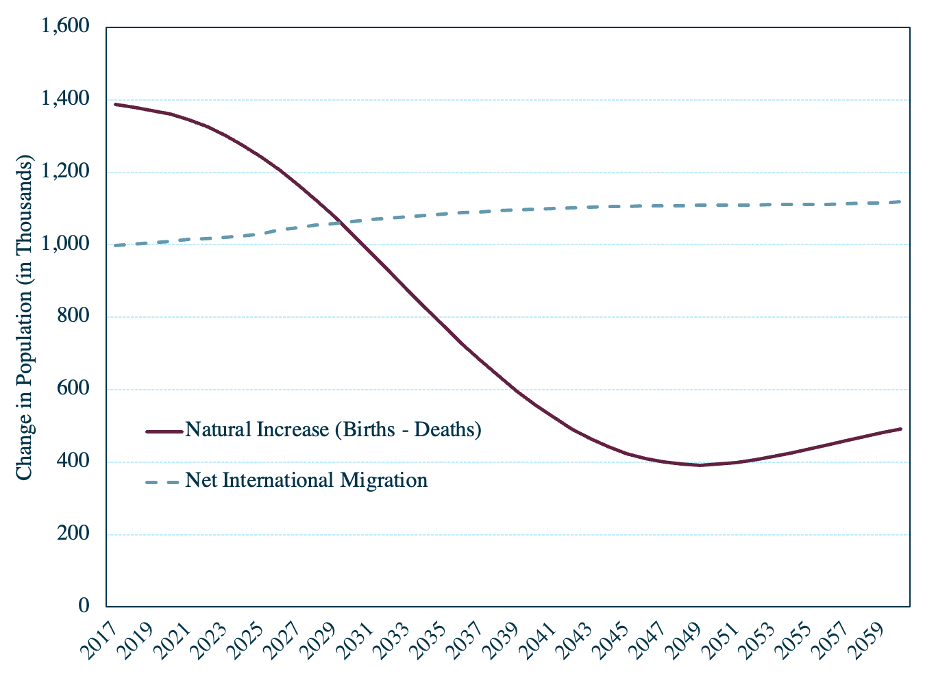
Source: U.S. Census Bureau, National Population Projections (data available upon request); Johnson, “A Changing Nation”, Figure 3.
How, then, do we view this year’s Budget and Economic Outlook? Demographics almost always matters in policy discussions, but it matters particularly this year as we come to grips with the emerging and perhaps dominating population trend for the foreseeable future: we are in the midst of another great wave of immigration, not unlike those famous migration decades of the 19th and early 20th centuries. If the current trends continue, the policy long-term implications are substantial.
Now, as then, demographics is destiny, and our budget priorities and outcomes will reflect that ground truth.