The interest costs of financing the national debt are now the second largest category of spending in the federal budget. Net interest outlays have surpassed national defense and Medicare, and trail only Social Security. Interest spending has grown to more than 2.5 times its pre-pandemic level, from $375 billion in FY 2019 to $971 billion in FY 2025.
The
U.S. Department of the Treasury recently released the
budget data through the first quarter (Q1) of fiscal year (FY) 2026 (covering October through December), showing that interest spending continues to rise.
Q1 of FY 2026 Interest Costs More than $270 Billion
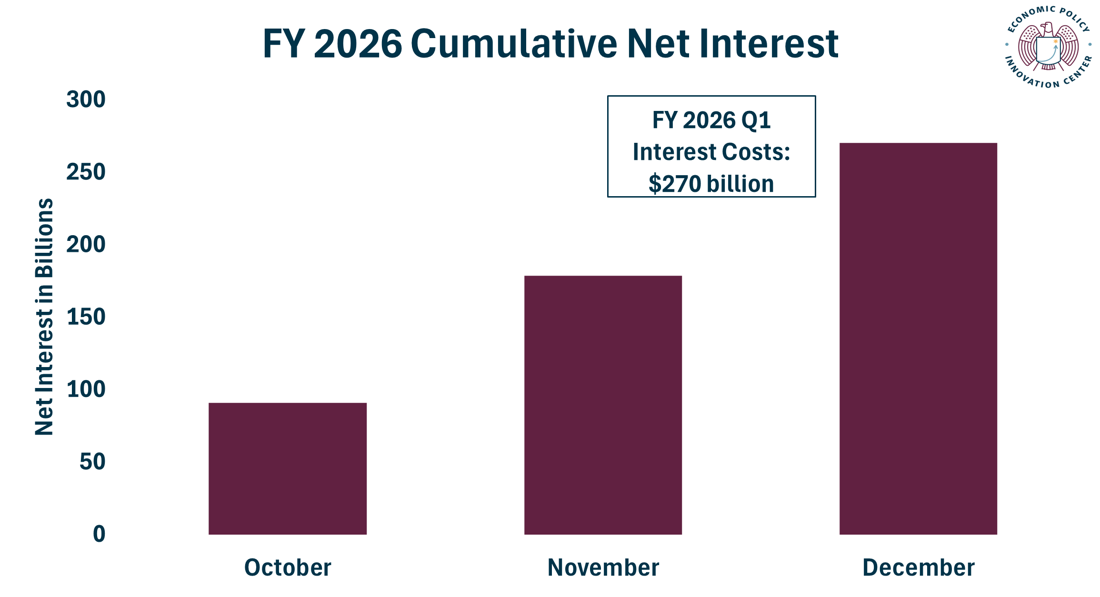
Net interest outlays totaled $270.3 billion through Q1 of FY 2026. That is about $10 billion more per month than in Q1 of FY 2025.
The interest payments in Q1 of FY 2026 exceed the total interest outlays for all of FY 2017 ($262.5 billion).
Interest as a Percent of Revenue
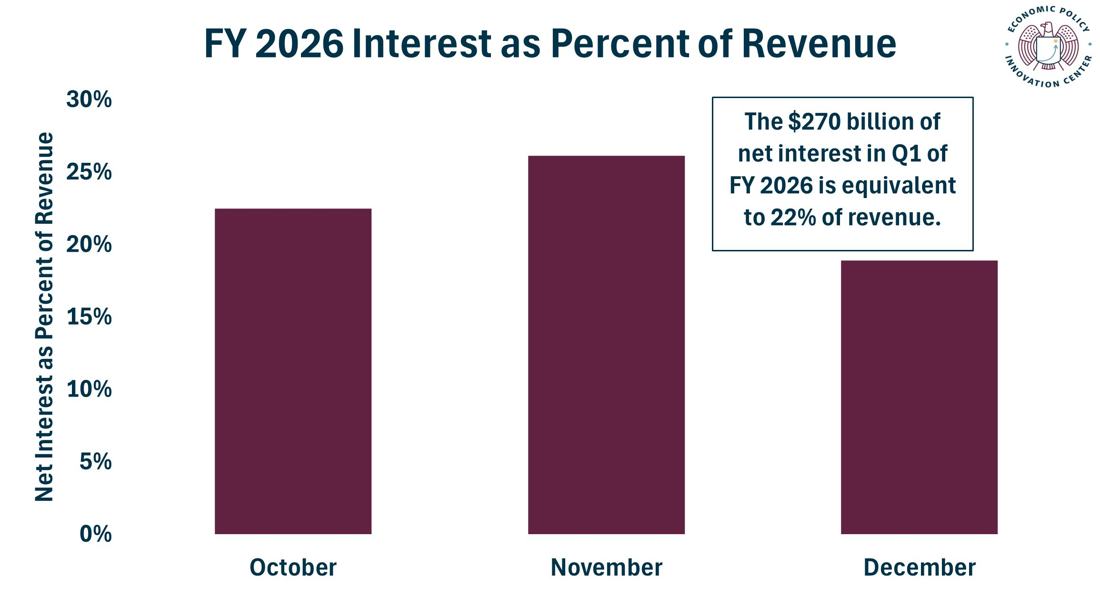
Net interest outlays were equivalent to 22.1% of total revenues through Q1 of FY 2026.
In Q1 of FY 2025, the net interest-to-revenues ratio was 22.3%. The average over the last 50 fiscal years is 12%.
The interest as a percentage of revenue ratio shows how much of the taxes collected are committed to servicing past borrowing, rather than carrying out the government’s core Constitutional duties.
Interest as a Percent of Total Spending
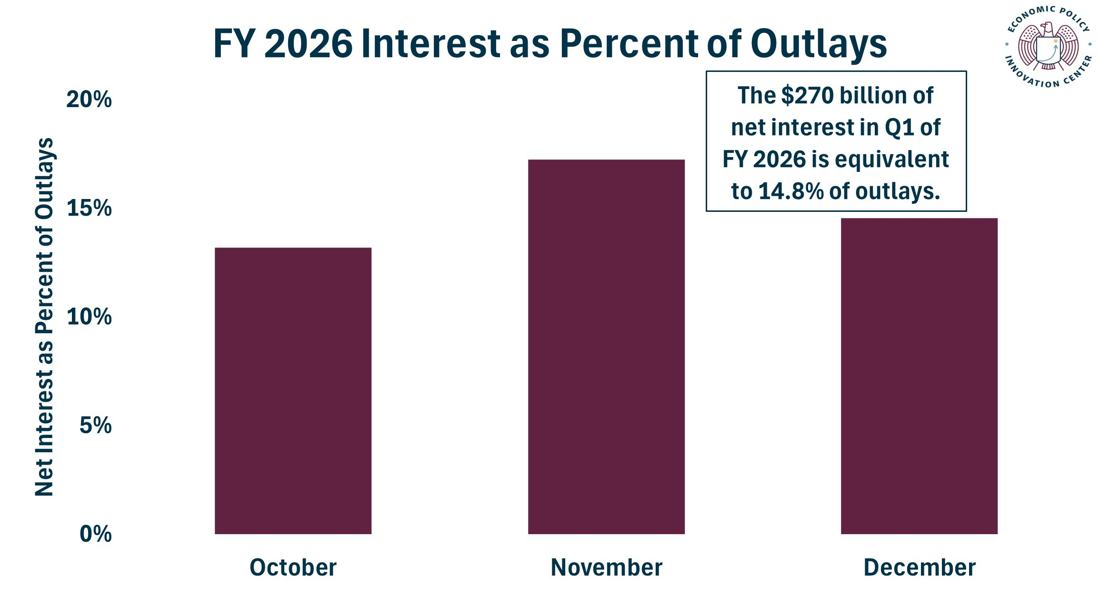
Net interest outlays were equivalent to 14.8% of total outlays through Q1 of FY 2026.
In Q1 of FY 2025, the net interest-to-outlays ratio was 13.5%. The average over the last 50 fiscal years is 8.9%.
The interest as a percentage of total spending ratio shows how much of the budget is allocated to interest spending rather than more important priorities.
Deficits
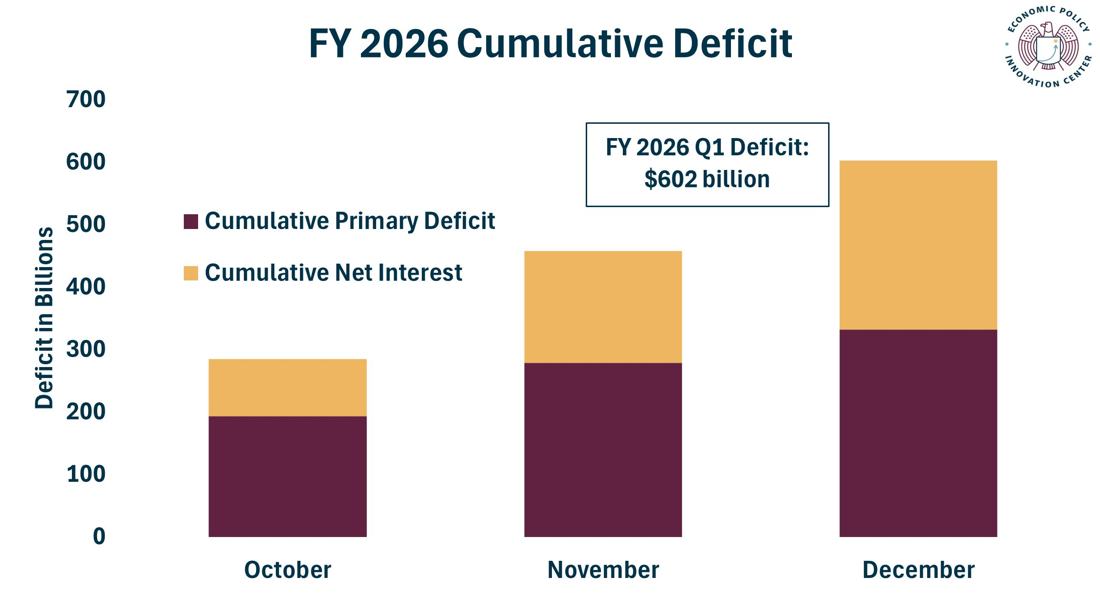
The deficit totaled $602.4 billion in Q1 of FY 2026. Net interest costs were 44.5% of the deficit.
In Q1 of FY 2025, the deficit was $710.9 billion. Compared to Q1 of last year, outlays are $33 billion higher while revenues are $142 billion higher. Interest costs were 34% of the deficit in Q1 of FY 2025.
Interest Rates
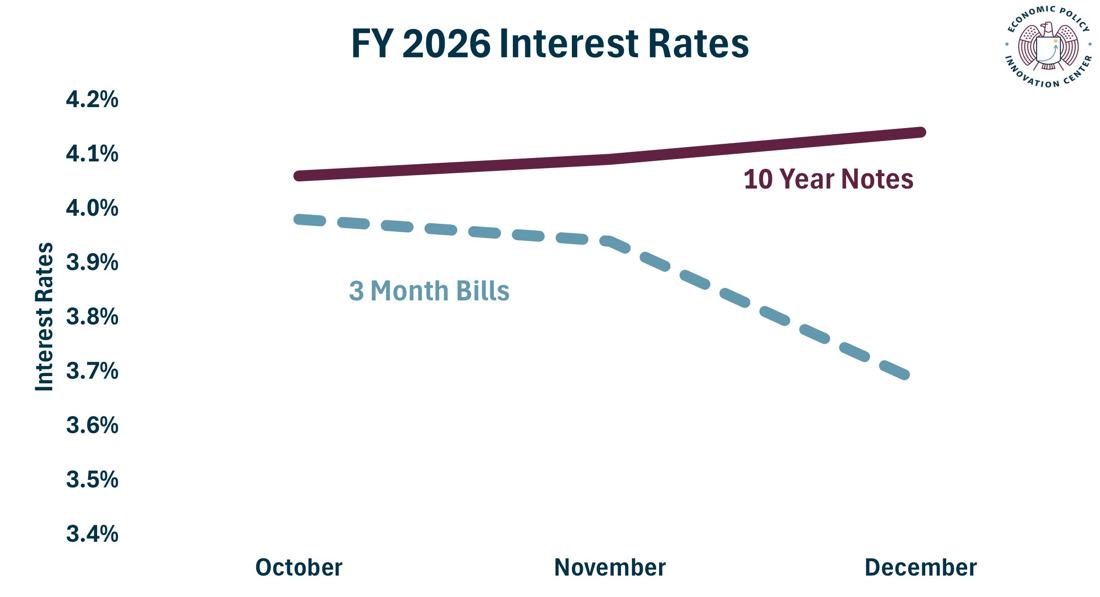
Interest rates on 10-year Treasury Notes averaged 4.1% in Q1 of FY 2026. Between October and December, the monthly average interest rate increased by 8 basis points, from 4.06% to 4.14%.
In Q1 of FY 2026, interest rates on 3-month Treasury Bills averaged 3.87%. Between October and December, the monthly average interest rate fell by 30 basis points, from 3.98% to 3.68%.
With the total national debt currently at
$38.5 trillion, even small changes in the interest rates on
Treasury debt can have significant consequences on the government’s
spending on interest and fiscal stability. If the interest rate is just 1% higher each year than projected in the Congressional Budget Office baseline, interest costs would be $3.2 trillion higher over the next decade.
Conclusion
Rising interest costs are a contributor to the unsustainability of the federal budget. However, interest spending is a symptom of the underlying problem of excessive programmatic spending. Interest is the cost of financing debt taken out to pay for past deficit spending. These deficits and the associated interest costs crowd out private sector investment and drive up interest rates, which make the cost of living less affordable for Americans.