Introduction: The Current Scenario
President Joe Biden has repeatedly claimed that Vice President Kamala Harris and his policies have reduced the deficit. This is simply not true.
[1] Even
The Washington Post gave President Biden’s claim a “Bottomless Pinocchio” rating.
[2]
But the White House continues to pitch a positive narrative, claiming the Biden-Harris Administration “delivered […] with a commitment to fiscal responsibility” by “lowering the deficit $1.3 trillion since taking office.”
[3]
In reality, the policies of the Biden-Harris Administration have increased federal spending by about $4.7 trillion, tax revenues by about $2.2 trillion, and the federal deficit by about $2.5 trillion compared to projections for fiscal years (FY) 2021 through 2024 made by the non-partisan Congressional Budget Office (CBO) immediately prior to the enactment of the Biden-Harris policy agenda. Debt through the end of FY 2024 was an estimated $3.9 trillion higher than projected. [4.The Congressional Budget Office’s February 2021 Budget and Economic Outlook projections provide a useful baseline against which to measure the effects of President Biden’s policies. This CBO Outlook included CBO’s fiscal and economic projections based on the laws in effect as of January 12, 2021, providing a clean slate immediately prior to any of President Biden’s policy agenda being enacted. Data from the February CBO baseline is referred to here as the “pre-Biden-Harris baseline.” Congressional Budget Office, The Budget and Economic Outlook: 2021 to 2031, February 11, 2021,
https://www.cbo.gov/publication/56970 (accessed October 1, 2024).]
| Biden-Harris Policies Increased
Spending, Taxes, Deficit, and Debt |
| |
2021 |
2022 |
2023 |
2024 |
Total |
| Outlays |
1,058 |
1,223 |
970 |
1,494 |
4,745 |
| Revenues |
541 |
903 |
239 |
566 |
2,249 |
| Deficit |
517 |
320 |
731 |
928 |
2,496 |
| Gross Debt |
-81 |
1,259 |
2,379 |
3,904 |
|
| Figures represent the differences between actual results and the projections in the pre-Biden-Harris February 2021 baseline, in Billions of Dollars.
Sources: EPIC Calculations based on data from CBO, OMB, and Treasury. |
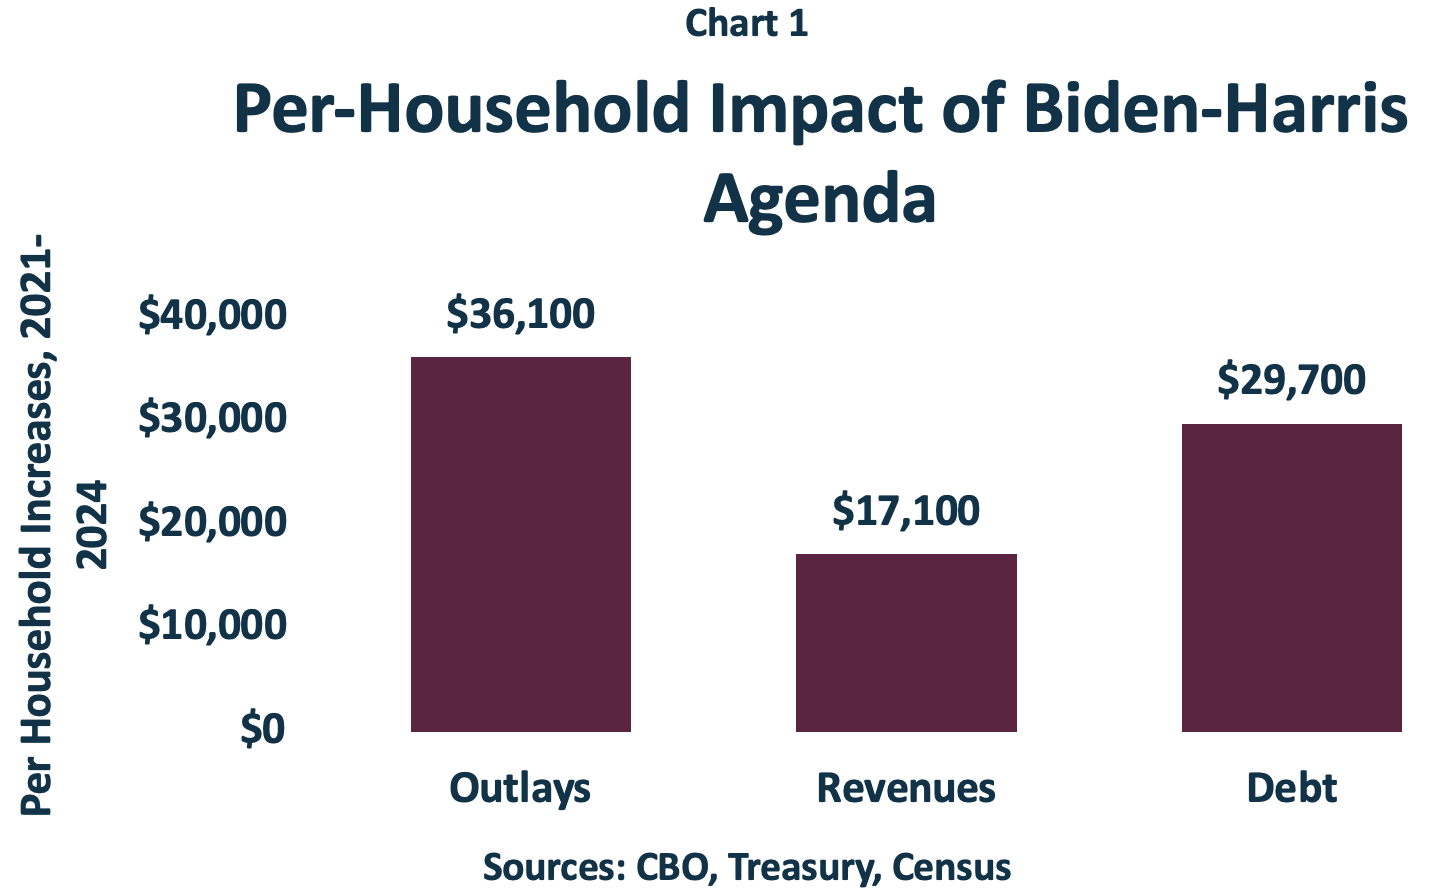
Over the course of four years, government spending has increased by the equivalent of $36,100 per American household, tax revenues by $17,100 per household, and debt by $29,700 per household.
The Biden-Harris Administration’s policies have driven prices up and real wages down. Inflation has grown nearly 20 percent since January 2021, but wages have not kept up with rising prices. That means that the average worker has seen the purchasing power of their take home pay fall by about $2,230 since the Biden-Harris Administration’s policies began.[5.Authors’ calculations based on average weekly earnings of all employees data and September CPI from Bureau of Labor Statistics. U.S. Bureau of Labor Statistics, “Employment, Hours, and Earnings from the Current Employment Statistics Survey (National),”
https://data.bls.gov/dataViewer/view/timeseries/CES0500000012 (accessed October 16, 2024), and U.S. Bureau of Labor Statistics, “Consumer Price Index News Release,”
https://www.bls.gov/news.release/cpi.htm (accessed October 16,2024).]
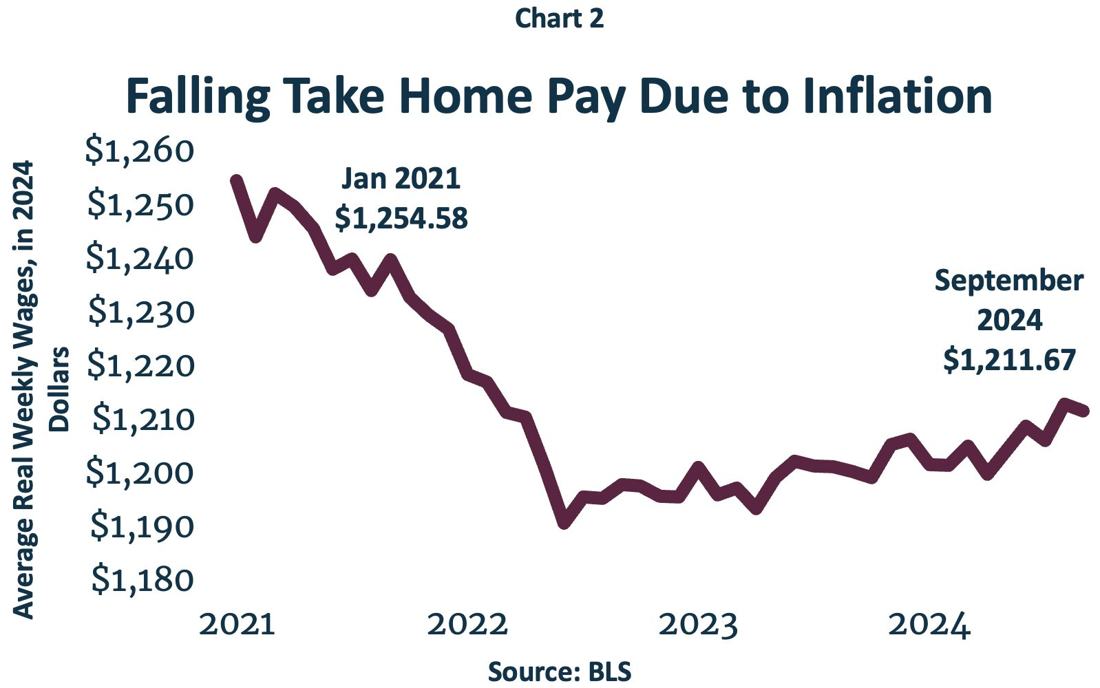
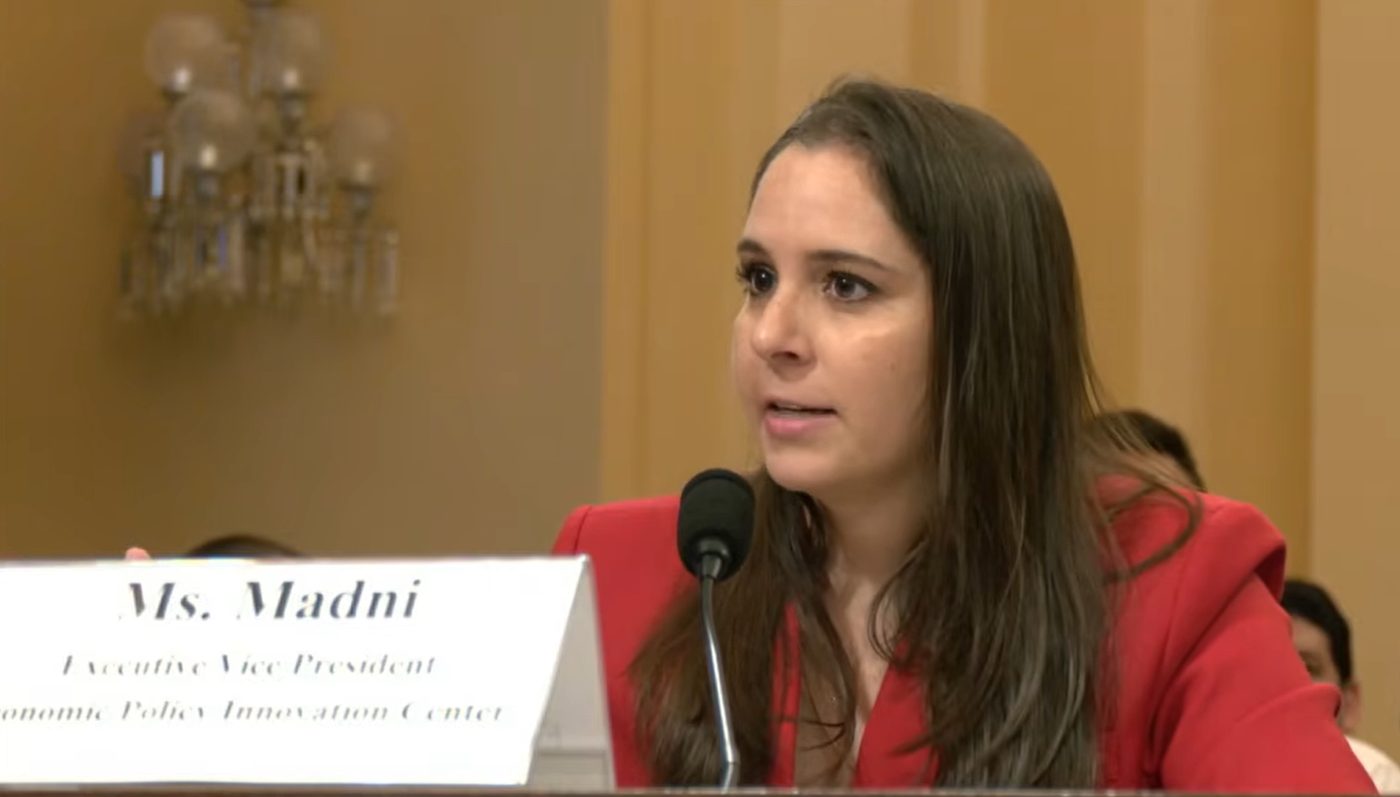
As described by EPIC President and CEO Paul Winfree in his recent testimony before the House Oversight and Accountability Committee, “The Biden-Harris Administration’s economic policy has increased costs, contributed to inflation, restricted barriers to entry, and hindered productive capital.”
[6]
Americans are certainly not better off now than they were four years ago.
Root Causes of the Spending Binge
The Biden-Harris spending binge was caused by two interrelated factors:
- Repeated, deliberate decisions to increase spending; and
- Autopilot increases to government spending in programs that are sensitive to inflation, which was caused by the irresponsible policies of the Biden-Harris Administration.
A Deliberate Decision to Increase Spending
A key goal of the Biden-Harris Administration has been to grow the size and scope of the federal government. The first Economic Report of the President stated that “a core aim of the Biden-Harris Administration’s economic policy agenda is to restore the public sector as a partner in long-run growth, with a particular focus on the economy’s supply side – from physical infrastructure to the vitality of the workforce.”
[7] The Administration has termed its efforts to grow the federal government “modern supply side economics” or the “new Washington consensus.”
Winfree further testified:
“On virtually every metric that can be measured, the Biden-Harris Administration has successfully grown the size and scope of the federal government over the past four years… The Biden-Harris Administration’s economic agenda is based on the foundation that public spending is the root of all jobs, income, and wealth creation. In reality, the administration’s economic policy has increased costs, contributed to inflation, restricted barriers to entry, and hindered productive capital. This has limited economic policy’s capacity to facilitate an environment conducive to widespread opportunity.”
[8]
The initial $1.9 trillion American Rescue Plan Act (ARPA) was followed by the massive Infrastructure Investment and Jobs Act, the misnamed Inflation Reduction Act, the Honoring our Promise to Address Comprehensive Toxins (PACT) Act, the Creating Helpful Incentives to Produce Semiconductor (CHIPS) and Science Act, supplemental spending for Ukraine, and large increases to the regular discretionary appropriations bills. These laws added trillions in new spending.
The new spending was not limited to the legislative agenda. The Biden-Harris Administration abused the regulatory process to expand government. The House Budget Committee reports that President Biden has proposed and implemented executive actions with fiscal costs exceeding $2 trillion, including the transfer of student loan debts from borrowers to taxpayers, unilaterally increasing Food Stamp benefit payments, and weakening Medicaid eligibility rules.
[9]
Inflation Caused by Irresponsible Spending
The Biden-Harris Administration’s irresponsible policies led to the highest rates of inflation in four decades.[10.See William Beach, “Is Inflation the Result of Excessive Deficit Spending?,” Economic Policy innovation Center, February 9, 2024,
../../the-economy/is-inflation-the-result-of-excessive-deficit-spending/.]
Inflation is much higher than projected by the CBO before the Biden-Harris Administration’s policy agenda was implemented. Since January 2021, the consumer price index (CPI-U) has increased nearly 20 percent.
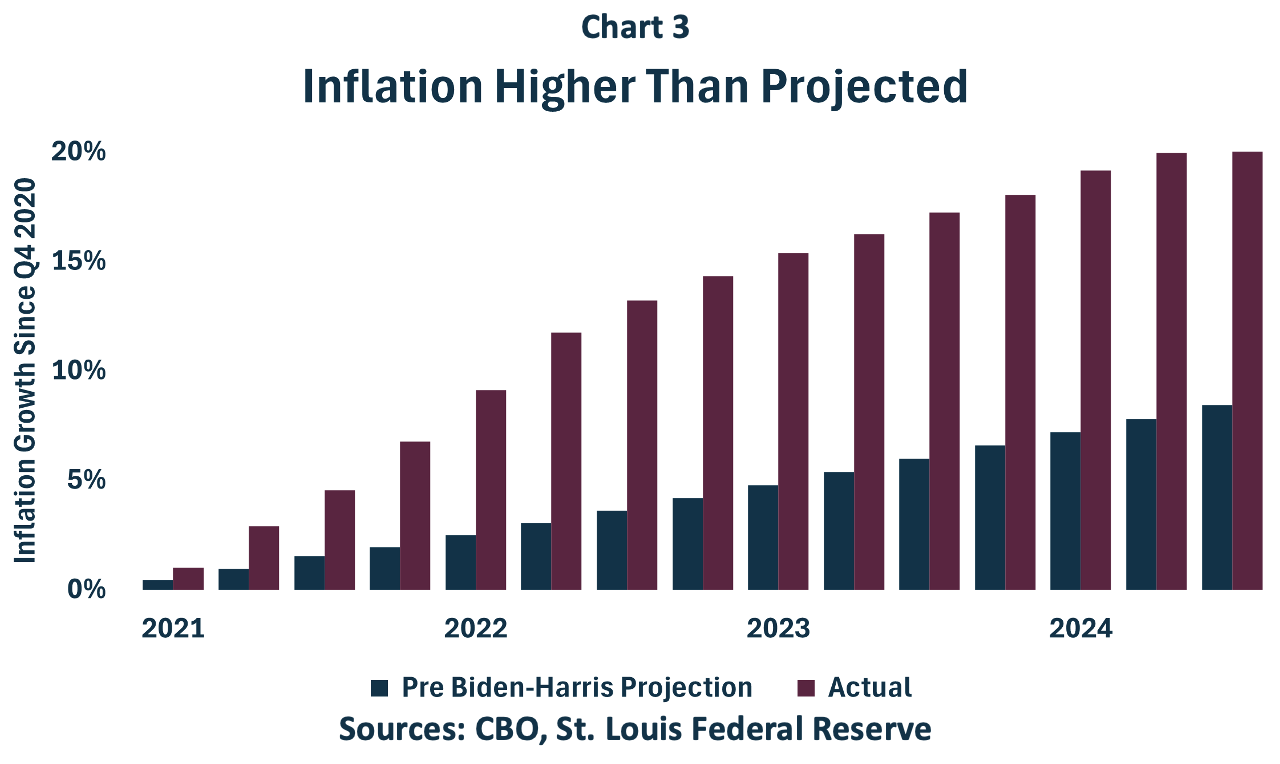
Inflation has a feedback effect into the federal budget, driving spending even higher. Programs such as Social Security automatically increase each year with inflation.
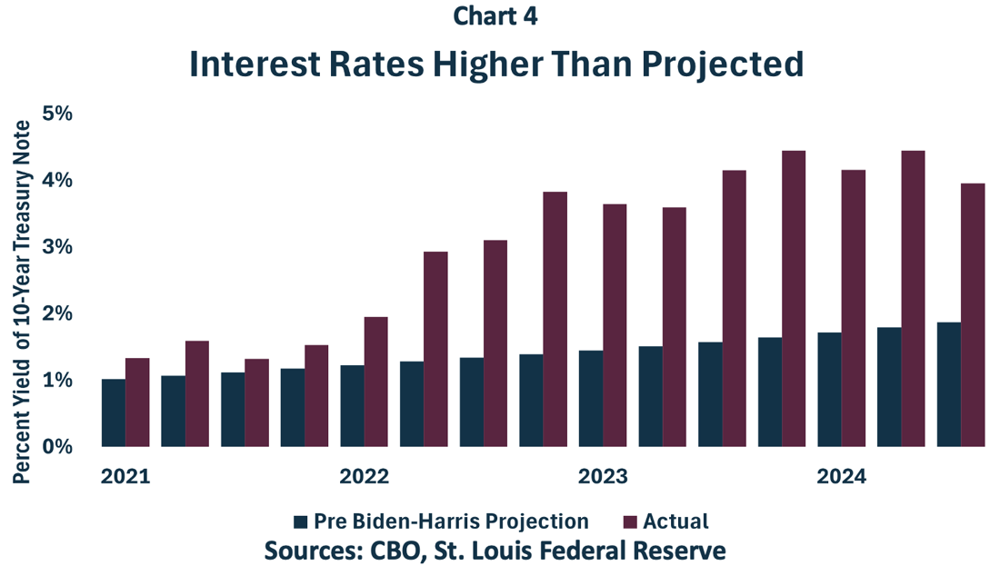
In particular, net interest payments to finance the deficit skyrocketed as interest rates rose and the primary deficit increased. The CBO’s pre-Biden-Harris projection for the interest rate on 10-year Treasury Notes for the third quarter of 2024 was 1.87 percent. The actual average 10-year interest rate for the third quarter of 2024 was 3.95 percent.
According to the CBO’s “rule of thumb,” if interest rates are one percentage point higher than projected each year over the budget window, that would add more than $3.2 trillion to federal spending over ten years.
[11]
Programs and Expenses that Drove Spending
The estimated $4.7 trillion spending increases above the pre-Biden-Harris projection between FY 2021 through 2024 were primarily driven by rising net interest costs, Medicaid expansion, Food Stamp benefit increases, higher Social Security costs, student loan debt transfers, bank bailouts, aid to Ukraine, union pension bailouts, increased veterans’ benefits, expanded Obamacare subsidies, increased transportation spending, ARPA stimulus payments, and the expanded child tax credit.
Rising Net Interest Costs
Net interest spending was the largest cause of actual spending exceeding the pre-Biden-Harris projections between FY 2021 to FY 2024. Actual net interest outlays between FY 2021 and FY 2024 were about $2.4 trillion, which was an estimated $1.2 trillion (106 percent) above the pre-Biden-Harris projection. The increase in net interest payments accounted for about 26 percent of the total increase in outlays above the pre-Biden-Harris baseline.
Net interest costs were higher than projected due to both a higher principal and higher interest rates on the national debt.
The actual FY 2021-2024 primary deficit (the gap between revenues and spending that needs to be financed by debt) was about $2.5 trillion (48 percent) higher than the pre-Biden-Harris baseline projection. This larger primary deficit is entirely attributable to non-interest outlays being $3.5 trillion higher than projected.
Medicaid Expansion
Actual Medicaid outlays from FY 2021-2024 were about $2.3 trillion, which was approximately $329 billion (16 percent) above the pre-Biden-Harris projection. The increase in Medicaid spending accounted for 7 percent of the total increase in outlays above the pre-Biden-Harris baseline.
The increase in enrollment is due primarily to the “continuous enrollment” policy that increased the federal matching rate by 6.2 percentage points to states that did not remove ineligible beneficiaries from Medicaid coverage while a public health emergency declaration was in effect. The public health emergency declaration was extended several times by the Biden Administration, even after President Biden himself said “the pandemic is over.” The restriction on eligibility redeterminations continued until April 2023, while the enhanced federal funding was extended at phased-down rates through the end of 2023. Between January 2021 and April 2023, Medicaid enrollment grew by more than 13.3 million individuals (18.3 percent) to 86.9 million.[12.Centers for Medicare & Medicaid Services, “June 2024 Medicaid and CHIP Enrollment Trends Snapshot,” June 2024,
https://www.medicaid.gov/medicaid/national-medicaid-chip-program-information/downloads/june-2024-medicaid-chip-enrollment-trend-snapshot.pdf (accessed October 9, 2024).]
Food Stamp Benefit Increases
Actual Food Stamp outlays from FY 2021-2024 were more than $524 billion, which was about $140 billion (36 percent) above the pre-Biden-Harris projection. The increase in Food Stamp spending accounted for 3 percent of the total increase in outlays above the pre-Biden-Harris baseline.
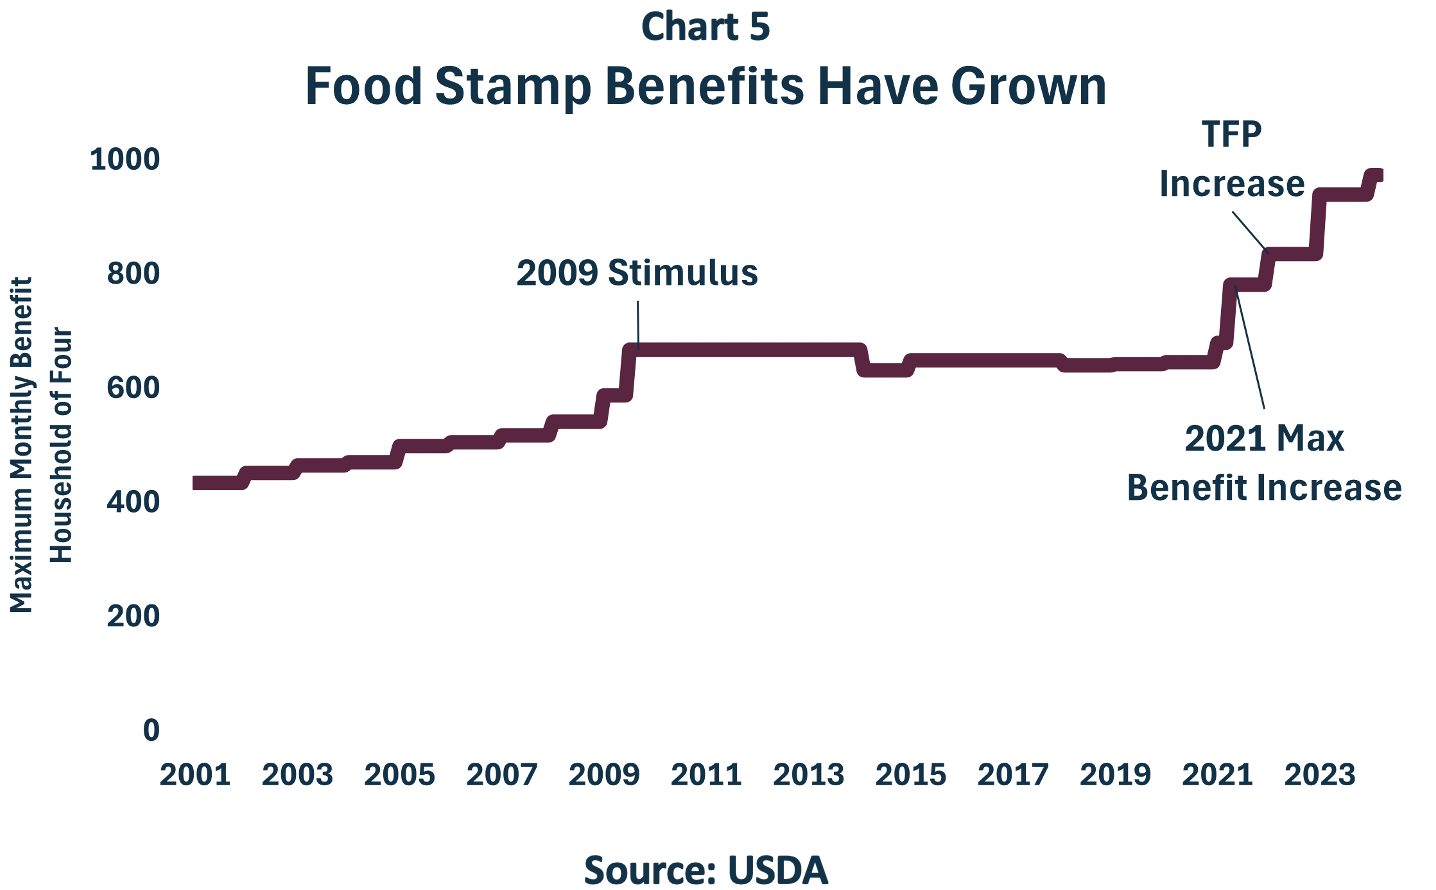
The increase in Food Stamp outlays is primarily due to policy changes meant to intentionally increase benefits (called allotments) faster than inflation.
[13]
In March 2020, the Families First Coronavirus Response Act provided “emergency allotments” to all Food Stamp recipients. Emergency allotments were available at the request of a state agency through the duration of the COVID-19 public health emergency declaration, even beyond when President Biden declared “the pandemic is over.” Emergency allotments finally ended in February 2023, pursuant to a provision in the FY 2023 Consolidated Appropriations Act.
The FY 2021 Omnibus signed into law in December 2020 included a provision increasing the maximum Food Stamp benefit by 15 percent through June 30, 2021. President Biden’s American Rescue Plan Act extended the increased maximum benefit through September 30, 2021.
The Biden Administration then unilaterally increased Food Stamp benefits by 21.03 percent through a “reevaluation” of the Thrifty Food Plan (TFP), which is used to calculate benefit levels, in 2021.
[14]
This administrative action broke precedent and violated Congressional intent. It was done for the purposes of keeping Food Stamp benefits elevated after the expiration of the emergency allotments and 15 percent maximum benefit increase. The CBO estimated that the TFP reevaluation will result in $250 to $300 billion in higher spending over the fiscal year 2022-2031 period.[15.Phillip L. Swagel, “The Cost of Eight Executive Actions Taken by the Biden Administration,” Congressional Budget Office, June 2022, 2022,
https://www.cbo.gov/publication/58231 (accessed October 7, 2024).] The USDA’s process in reevaluating the TFP was severely criticized by the U.S. Government Accountability Office (GAO).[16.U.S. Government Accountability Office, “Thrifty Food Plan: Better Planning and Accountability Could Help Ensure Quality of Future Reevaluations,” GAO-23-105450, December 14, 2022,
https://www.gao.gov/products/gao-23-105450 (accessed October 7, 2024); and Edda Emmanuelli Perez, “United States Department of Agriculture—Applicability of the Congressional Review Act to the 2021 Updates to the Thrifty Food Plan,” U.S. Government Accountability Office, B-333732, July 28, 2022,
https://www.gao.gov/products/b-333732 (accessed October 7, 2024).]
Social Security COLA
Actual Social Security outlays from FY 2021-2024 were an estimated $5.2 trillion, which was about $195 billion (4 percent) above the pre-Biden-Harris projection. The increase in Social Security spending accounted for 4 percent of the total increase in outlays above the pre-Biden-Harris baseline.
Social Security is sensitive to inflation, as it provides a cost-of-living adjustment (COLA) for benefits each year. The COLA was 3.2 percent for calendar year 2024, 8.7 percent for 2023, and 5.9 percent for 2022. These were the largest COLAs since the early 1980s, when inflation was high, and the Social Security Trust Fund faced insolvency. Once again, the Trust Fund is within a decade of depletion as the program pays out more in benefits than it collects in taxes from workers.
[17]
Department of Education and Student Loan Debt Transfer
Actual outlays for the U.S. Department of Education from FY 2021-2024 were greater than $1.1 trillion, which was about $698 billion (163 percent) above the pre-Biden-Harris projection. The increase in Education spending accounted for 15 percent of the total increase in outlays above the pre-Biden-Harris baseline.
The Biden-Harris Administration has transferred the costs of student loan debt from borrowers to taxpayers. Through several rounds of executive actions, the Department of Education suspended loan repayments and the accrual of interest for borrowers, discharged debt, and provided loan forgiveness. Even after the Supreme Court struck down one of the Biden-Harris Administration proposals, the Administration has continued its efforts to transfer student loan debt. The “Saving on a Valuable Education” (SAVE) income driven repayment (IDR) plan issued in July 2023 was estimated by the CBO to cost taxpayers more than $260 billion.
The American Rescue Plan Act provided $169 billion in additional funding for elementary, secondary, and higher education systems. These funds were presumably meant to help school systems respond to the challenges of COVID-19. However, it has been reported that that funds were used for purposes unrelated to returning to in-person learning, and were even used to implement critical race theory programs.
[18]
FDIC and Bank Bailouts
Actual outlays from the Federal Deposit Insurance Corporation (FDIC) Fund were greater than $113 billion from FY 2021-2024, which was about $134 billion (620 percent) above the pre-Biden-Harris projection (the Deposit Insurance Fund normally collects more in assessments, which are recorded as offsetting collections or negative outlays, than it spends out in payments). The higher Deposit Insurance Fund spending accounted for 3 percent of the total increase in higher outlays above the pre-Biden-Harris baseline.
Bank deposits up to $250,000 are guaranteed by payments from the Deposit Insurance Fund. Three of the four largest bank failures in U.S. history occurred in 2023, with First Republic Bank, Silicon Valley Bank, and Signature Bank entering FDIC receivership. The FDIC made a systemic risk exception to the $250,000 deposit insurance limit and instead guaranteed all deposits at Silicon Valley Bank and Signature Bank. According to the Treasury Department, the FDIC made a $49.4 billion transaction in September 2023 with the Federal Financing Bank related to the receivership of First Republic Bank.[19.The White House, “Joint Statement of Janet L. Yellen, Secretary of the Treasury, and Shalanda D. Young, Director of the Office of Management and Budget, on Budget Results for Fiscal Year 2023,” October 20, 2023,
https://www.whitehouse.gov/omb/briefing-room/2023/10/20/joint-statement-of-janet-l-yellen-secretary-of-the-treasury-and-shalanda-d-young-director-of-the-office-of-management-and-budget-on-budget-results-for-fiscal-year-2023/.]
The rapid rise in interest rates in response to high inflation contributed to the failures of these financial institutions.
Defense and International Security Assistance for Ukraine
National defense outlays totaled an approximately $3.2 trillion from FY 2021-2024, which was about $157 billion (5 percent) higher than the pre-Biden-Harris projection.
International Security Assistance Program outlays totaled about $87 billion, which was an estimated $41 billion (88 percent) higher than the pre-Biden-Harris baseline.
Together, the $198 billion in higher-than-projected Defense and International Assistance outlays accounted for 4 percent of the total increase in outlays above the pre-Biden-Harris baseline.
Aid to Ukraine is a significant contributor to the increase in Defense and International Assistance outlays relative to the pre-Biden-Harris projection. Since March 2022, $174.2 billion has been appropriated for supplemental military and other assistance related to the Russian invasion of Ukraine. The majority of funding has been for the U.S. Department of Defense, which has received $110.7 billion. The U.S. Department of State and USAID have received $57.8 billion.[20.U.S. Department of Defense, Fiscal Year 2025 Joint Strategic Oversight Plan, September 25, 2024, pp. 14-16,
https://media.defense.gov/2024/Sep/27/2003555026/-1/-1/1/FY2025%20JSOP_OAR_FINAL_508.PDF (accessed October 9, 2024).]
PBGC and Union Pension Bailout
Actual outlays from the Pension Benefit Guaranty Corporation (PBGC) fund from FY 2021-2024 totaled about $51 billion, which was an estimated $77 billion (298 percent) higher than the pre-Biden-Harris projection (the PBGC normally collects more in premiums, which are recorded as offsetting collections or negative outlays, than it spends out in payments). The increased spending from the PBGC fund accounted for 2 percent of the total increase in outlays above the pre-Biden-Harris baseline.
President Biden’s American Rescue Plan Act included a massive taxpayer-funded bailout for poorly managed union pension plans. This politically motivated “Special Financial Assistance” bailout provides one-time cash deposits of about $97 billion directly into the accounts of approximately 250 of the most financially troubled multiemployer pension plans. Rather than fix the broken structure, flawed funding rules, or the PBGC’s long-term viability, the bailout set a precedent, increasing the risk of even greater pension losses or additional taxpayer bailouts for worsening unfunded union pension promises.
[21]
Veterans Benefits Increase
Actual outlays for veterans’ programs from FY 2021-2024 were more than $1.1 trillion, which was about $112 billion (11 percent) above the pre-Biden-Harris projection. The increase in veterans spending accounted for 2 percent of the total increase in outlays above the pre-Biden-Harris baseline.
The Honoring our PACT Act of 2022 was enacted in August 2022. This legislation significantly increased spending on veterans programs, including the creation of the Toxic Exposures Fund. The CBO said that the PACT Act will increase deficits by $797 billion over the FY 2022-2032 period.
[22]
Obamacare Subsidies Expansion
Refundable premium tax credits under the misnamed Affordable Care Act totaled about $337 billion from FY 2021-2024, which was approximately $143 billion (73 percent) higher than the pre-Biden-Harris baseline. The higher spending for these Obamacare subsidies accounted for 3 percent of the total increase in outlays above the pre-Biden-Harris baseline.
President Biden’s American Rescue Plan Act significantly expanded Obamacare subsidies, including by eliminating the maximum income for eligibility for taxpayer subsidies and reducing the amount (even down to $0) that recipients must pay for benchmark plans.
The Inflation Reduction Act of 2022 then extended the expanded subsidies through 2025.
Transportation Spending Increase
Actual outlays for transportation programs from FY 2021-2024 were about $549 billion, which was an estimated $66 billion (14 percent) above the pre-Biden-Harris projection. The increase in transportation spending accounted for 1 percent of the total increase in outlays above the pre-Biden-Harris baseline.
The Infrastructure Investment and Jobs Act was enacted in November 2021. This legislation was meant to significantly increase spending on transportation infrastructure as well as on green energy, climate programs, and broadband infrastructure over a five-year period.
ARPA Stimulus Checks
In 2021, the American Rescue Plan Act implemented a third round of COVID-19 stimulus checks that cost about $402 billion, according to the CBO’s estimates.
[23]
Millions of individuals received checks of up to $1,400.
[24]
Child Tax Credit Expansion
Outlays for the refundable Child Tax Credit (CTC) totaled more than $265 billion from FY 2021-2024, which was about $153 billion (137 percent) higher than the pre-Biden-Harris baseline. The higher spending for these welfare payments accounted for 3 percent of the total increase in outlays above the pre-Biden-Harris baseline.
While the CTC is a part of the tax code, the refundable tax credit primarily provides welfare payments rather than tax relief. ARPA significantly expanded the CTC for 2021, including doubling the size of the maximum refundable portion of the credit.
Notably, the ARPA expansion gutted the work requirements for the CTC by eliminating the earned income requirement for full refundability. The CBO estimated the ARPA CTC expansion would increase outlays by $89 billion and reduce revenues by $21 billion.
Rising Revenues
Actual federal revenues totaled more than $18.3 trillion from FY 2021-2024, about $2.2 trillion (14 percent) more than the pre-Biden-Harris baseline.
The Biden-Harris Administration has implemented a mix of tax increases and tax subsidies to benefit favored industries and activities. The misnamed Inflation Reduction Act imposed a new corporate alternative minimum tax, an excise tax on repurchases of corporate stocks, a methane emissions tax, and other revenue raisers. At the same time, the Biden-Harris Administration has provided hundreds of billions of tax credits for green energy, electric vehicles, manufacturing computer chips, health programs, and welfare programs.
Inflation is another factor that has increased revenue collections. As nominal incomes and profits increase (even if they may not keep up with inflation in real terms), taxes owed by individuals, corporations, and for payroll taxes grow.
Conclusion
The Biden-Harris Administration has spent the past four years placing our country on an unsustainable spending path that threatens the economic stability of Americans both today and for generations to come.
The Administration delivered on its promise to expand the federal government by spending approximately $4.7 trillion more than was projected under previous policy. Revenues could not keep pace with the spending spree and debt surpassed the projected level by about $3.9 trillion.
President Biden and Vice President Harris increased funding for welfare programs and student loan forgiveness programs while interest payments on government debt soared.
Deliberate decisions to increase spending drove inflation, which in turn exacerbated autopilot spending. Despite the Administration’s claims, evidence makes it clear that these reckless policy decisions have left Americans worse off than they were prior to President Biden and Vice President Harris entering office.
The past four years reveal that this Administration was willing to push an agenda of expanded federal government at the expense of American taxpayers’ wellbeing and the long-run financial security of our country.